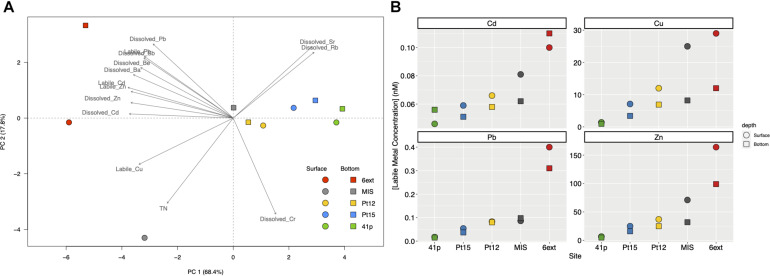
FIGURE 2.
Principal component analysis (PCA) biplot based on the environmental variables of surface and bottom seawater samples collected at the five different sites (A) and labile trace metals concentrations (Cd, Cu, Pb, and Zn) in surface and bottom of seawater at the different sampling sites. (B) Dotplots represent the labile metal concentrations (in nM), along each sampling sites (i.e. 6ext, MIS, Pt12, Pt15, and 41p) in surface biofilm (circle) and bottom biofilm (square) samples. Colors and shapes of symbols depend on site sampling and depth sampling, respectively.

