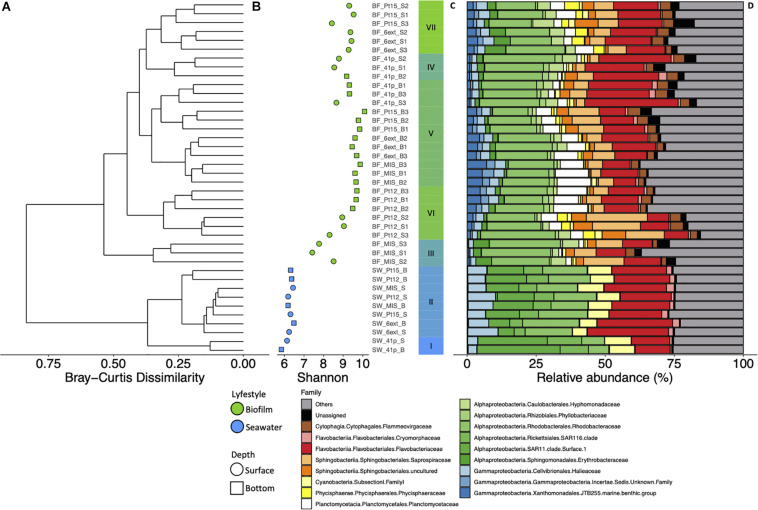
FIGURE 3.
Dendrogram clustering represents the Bray-Curtis dissimilarity of taxonomic profile, conducted from the OTU abundance table (A). The scale bar of the dendrogram represents the dissimilarity level (%) between prokaryotic community. Shannon index values calculated from 16S rRNA OTU table along each sampling sites (i.e., 6ext, MIS, Pt12, Pt15 and 41p) in surface (circle) and bottom (square) samples for biofilm (green) and seawater (blue) samples (B). Barplot representing the cluster from the Bray-Curtis dendrogram (C). Structure of prokaryotic community at the family level in seawater and biofilm at surface and bottom waters at the five different sites of Toulon Bay (D). Each bar represents the relative abundance of family in the studied samples.

