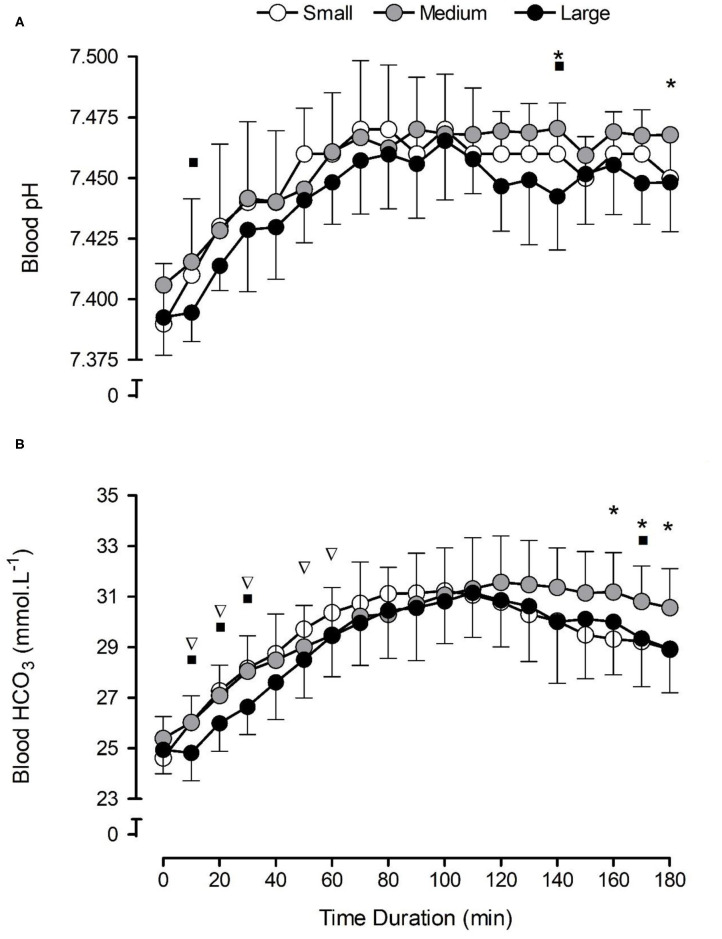
Figure 1.
Mean (±SD) temporal blood pH (A) and bicarbonate concentration [] (B) responses following the consumption of 0.3 g·kg−1 body mass NaHCO3 in small-, medium-, and large-sized capsules. *a condition × time interaction between small and medium capsules, where p < 0.05. ∇a condition × time interaction between small and large capsules, where p < 0.05. ■a condition × time interaction between medium and large capsules, where p < 0.05.

