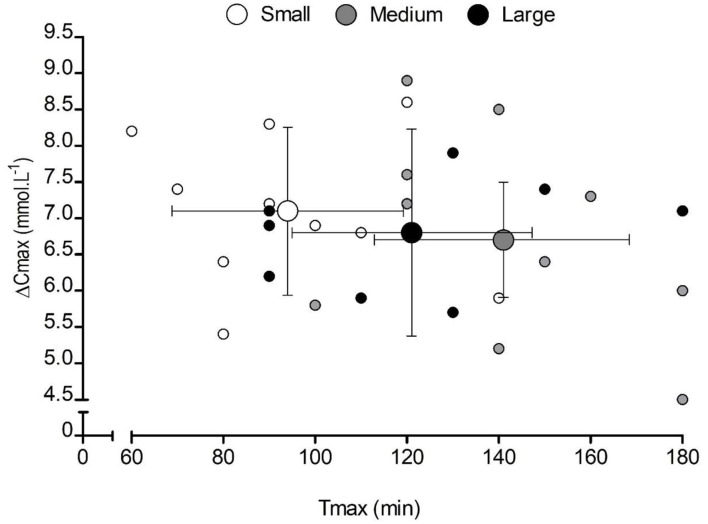
Figure 2.
Mean (±SD) and individual peak changes in blood bicarbonate concentration [] (ΔCmax) following the consumption of 0.3 g·kg−1 body mass NaHCO3 in small-, medium-, and large-sized capsules. Small markers represent individual responses, and large markers represent the mean data for each capsule condition. The X and Y whiskers represent the SD of the sample in each condition for time-to-peak [] (Tmax and ΔCmax, respectively).

