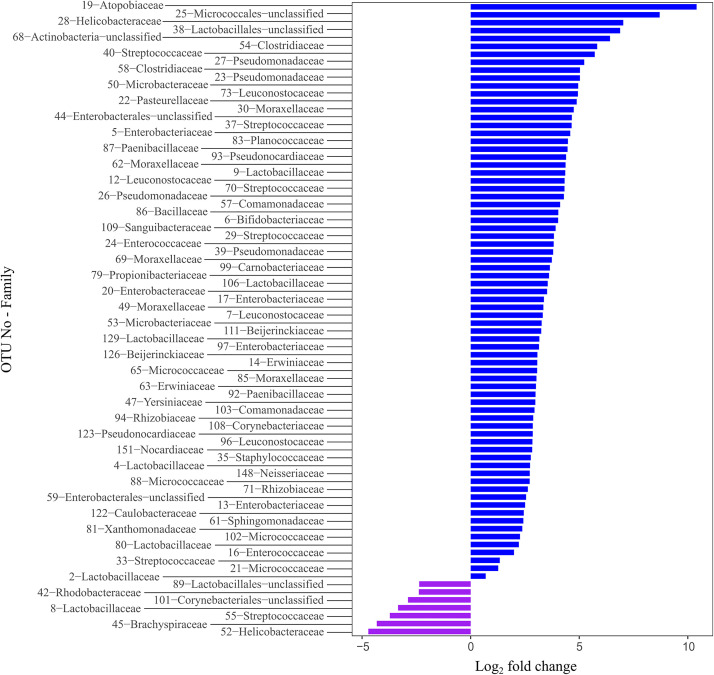
FIGURE 4.
The differentially abundant phyla between the zebra finches and the Bengalese finches. Bars represent OTUs that are significantly differentially abundant between the two host species. OTUs with a log2–fold–change larger than zero are more abundant in the zebra finches (blue bars), while the OTUs with a log2–fold–change smaller than zero are more abundant in the Bengalese finches (purple bars).

