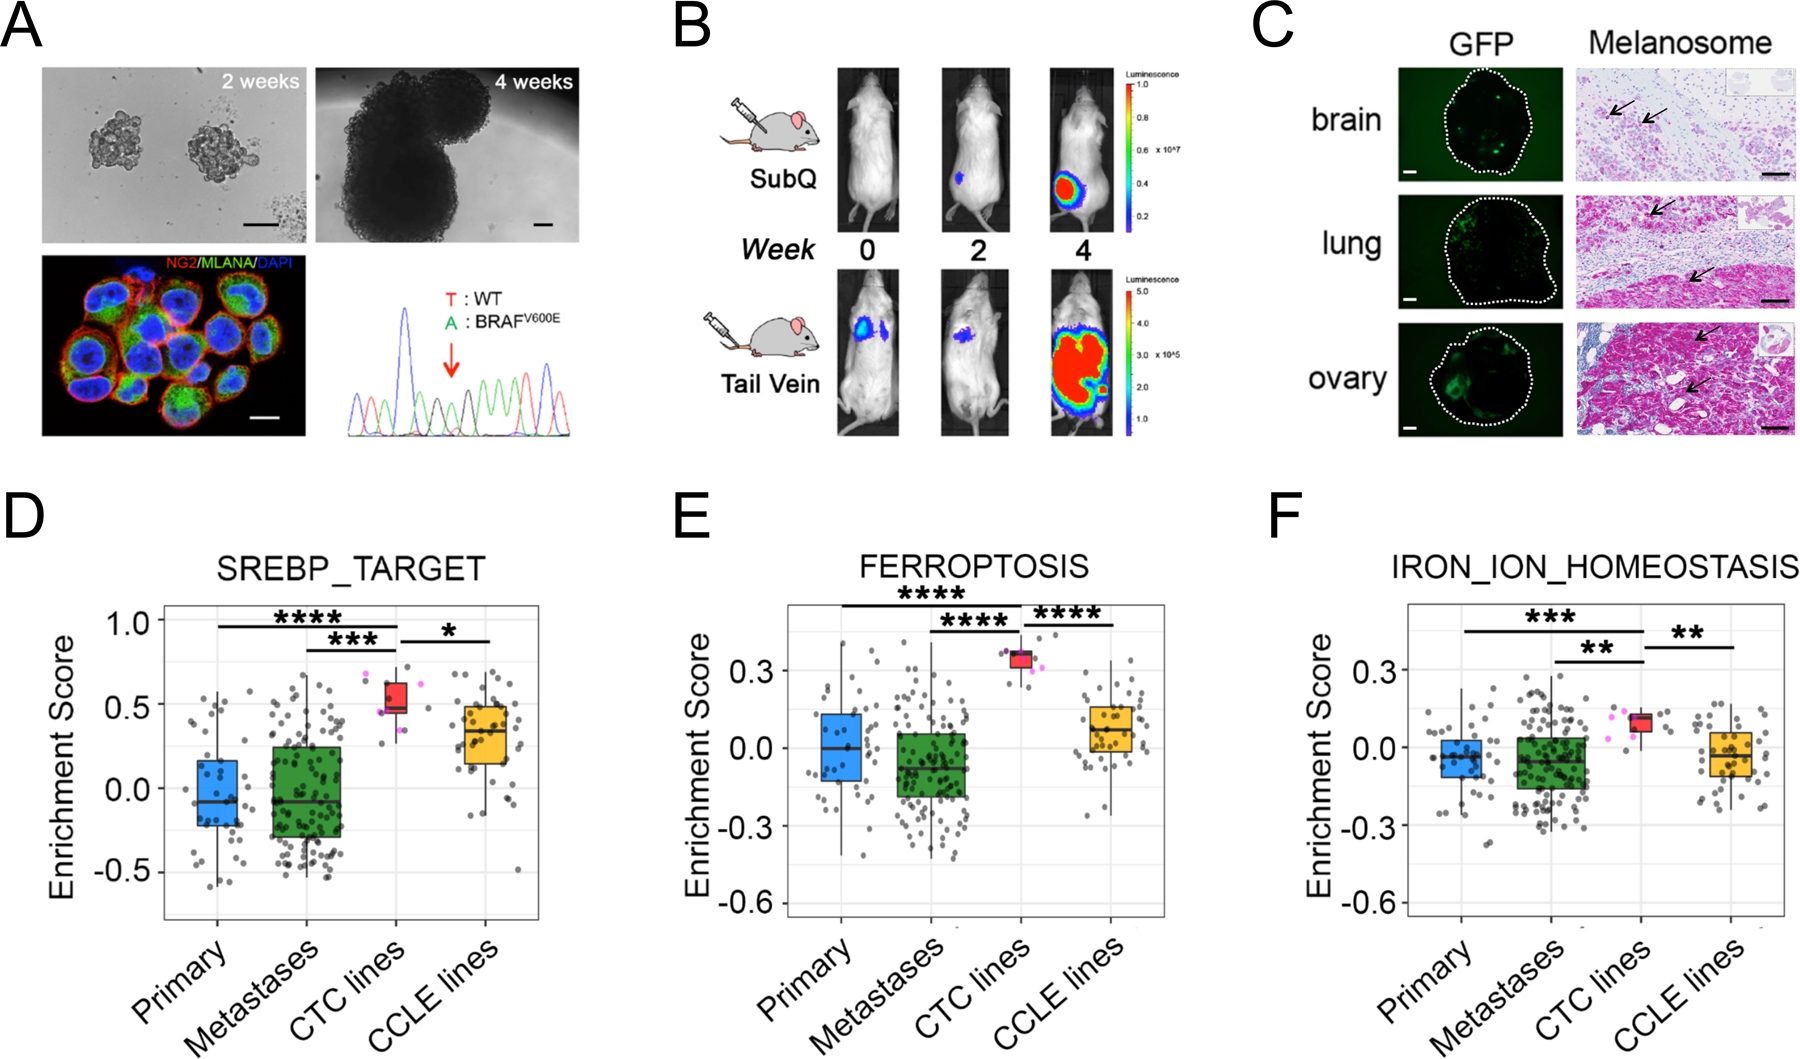
Figure 1. Lipogenic and iron homeostasis signatures are elevated in melanoma patient-derived CTC lines.

(A) Characterization of ex vivo-cultures of melanoma Mel-167 CTCs. Upper panels: bright field images of suspension cultures at 2 weeks (left, scale bar: 100 μm) and 4 weeks (right, scale bar: 100 μm); Lower left: Representative immunofluorescence image of cultured CTCs co-stained for melanoma markers CSPG4 (red) and MLANA (green), with nuclear DAPI (blue). Scale bar: 10μm. Lower right: DNA sequencing identifies the heterozygous BRAFV600E mutation (T-> A at nucleotide 1799) in the cultured melanoma Mel-167 CTCs.
(B) Melanoma Mel-167 CTCs are tumorigenic in mice. Primary tumors (Upper panel) and metastases (Lower panel) following subcutaneous and tail vein injection in NSG mice, respectively, of GFP-luciferase-tagged Mel-167 CTCs, monitored over 4 weeks using in vivo imaging (IVIS).
(C) Intra-cardiac inoculation of GFP-luciferase-tagged Mel-167 CTCs into NSG mice leading to metastases in brain, lung and ovary. Representative images of GFP expressing tumor cells in tissue sections (Left panels, hatched circles, scale bar: 2mm) and immunohistochemical staining for melanosomes (Right panels, purple stain of individual melanoma cells marked by black arrows, with whole tissue section shown on the top right box; scale bar: 100 μm).
(D-F) GSVA pathway enrichment box plots of (D) SREBP_TARGET, (E) FERROPTOSIS and (F) IRON_ION_HOMEOSTASIS, comparing melanoma CTC cell line samples (n = 13, including 5 distinct lines colored in pink and 8 sample repeats of these 5 lines in grey) with TCGA high purity primary melanomas (n = 45) (Primary), TCGA high purity metastatic melanomas (n = 129) (Metastases) and CCLE melanoma cell lines (n = 49). The mean GSVA enrichment scores were calculated for replicates of each CTC line. Pairwise comparisons between CTC lines and the other three categories were performed and statistical significance was assessed by two-sided Welch’s t-test. ****P < 0.0001; ***P < 0.001; ** P < 0.01; * P < 0.05. Curated pathway signature gene lists are found in Supplementary Table S2.
