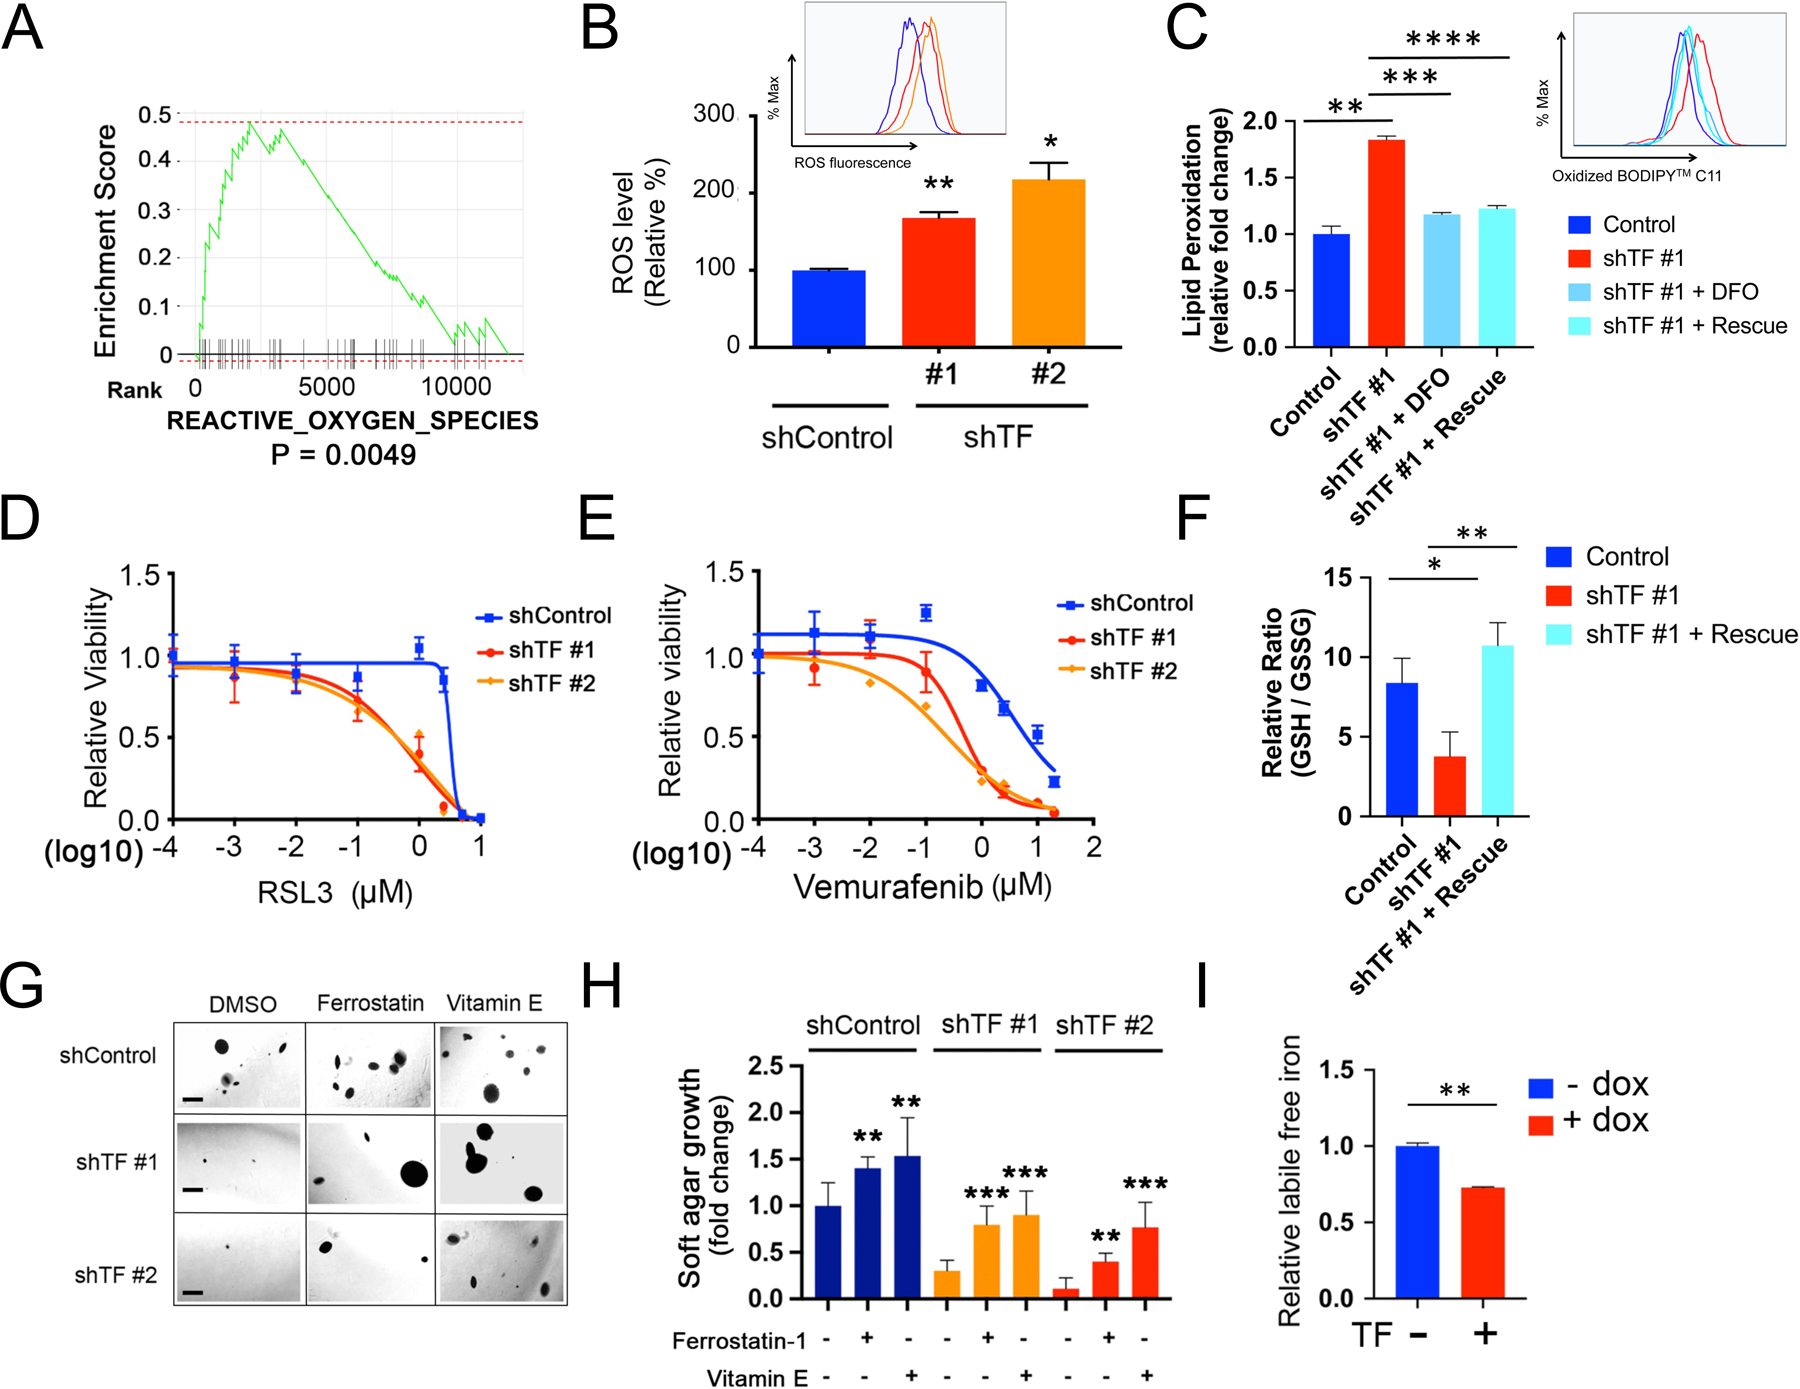
Figure 5. Transferrin modulates ferroptotic cell death.

(A) GSEA pathway enrichment plot showing significant downregulation of “REACTIVE_OXYGEN_SPECIES” (ROS) pathway following TF-KD in Mel-167 melanoma CTCs, compared to shControl.
(B) Increased intracellular ROS in Mel-167 melanoma CTCs following TF-KD, using two independent shRNA constructs (#1, #2), compared with scrambled construct (shControl). ROS was quantified by flow cytometric analysis with a fluorescent ROS probe and the geometric mean of fluorescence signal was calculated for each group. The differences between the two groups were assessed by two-sided Welch’s t-test. statistical significance: P = 0.0028 for shTF#1 compared to shControl; P = 0.0104 for shTF#2 compared to shControl. ** P < 0.01; *P < 0.05.
(C) Quantification of lipid peroxidation levels by flow cytometry in Mel-167 CTCs following knockdown of TF (shTF#1), compared with shControl cells. The increase in lipid peroxidation induced by TF-KD is abolished either by the addition of the iron chelator deferoxamine (DFO; 50 μM with preincubation for 12 hours before flow cytometric assay), or by expression of TF ALT cDNA (rescue), a synthetic construct in which mutation of three 3rd position non-coding nucleotides renders TF resistant to targeting by shTF#1 without affecting expression levels (see Figure S8A, S8B). Lipid peroxidation is measured using BODIPY™ 581/591 C11 molecular sensor, and the fraction of cells positive for lipid peroxidation were calculated and data normalized to shControl. Y axis represents fold change. Statistical significance was assessed by two-sided Welch’s t-test. ** P < 0.01; *** P < 0.001; ****P < 0.0001.
(D) TF-KD enhances Mel-167 melanoma CTC cytotoxicity by the ferroptosis inducer RSL3. TF-KD was achieved using two different shRNAs, scrambled shControl. Y axis represents relative cell viability. X axis represents drug concentrations (μM) in log10 scale. Statistical significance was assessed by two-sided Welch’s t-test. When shTF#1 is compared to shControl: 1 μM, P = 0.0001; 2.5 μM, P = 0020. When shTF#2 is compared to shControl: 1 μM, P = 7.69 × 10⁻⁵; 2.5 μM, P = 0021; 5 μM, P = 0179.
(E) TF-KD increases sensitivity to vemurafenib in BRAFV600E-mutant melanoma Mel-167 CTCs. TF-KD was achieved using two different shRNAs and compared with scrambled shControl. Y axis represents relative cell viability. X axis represents drug concentrations (μM) in log10 scale. Statistical significance was assessed by two-sided Welch’s t-test. When shTF#1 is compared to shControl at different drug concentrations: 0.1 μM, P = 0.0246; 1 μM, P = 2.07 × 10⁻⁵; 2.5 μM, P = 2.14 × 10⁻⁶; 10 μM, P = 0.0001; 20 μM, P = 0.0007. When shTF#2 is compared to shControl: 0.01 μM, P = 0.0010; 0.1 μM, P = 0.0004; 1 μM, P = 9.38 × 10⁻⁶; 2.5 μM, P = 8.70 × 10⁻⁵; 10 μM, P = 0.0006; 20 μM, P = 0.0011.
(F) Reduced ratio of GSH/GSSG in TF-KD Mel-167, compared with vector Control. A synthetic TF ALT cDNA, resistant to shTF#1 knockdown, rescues the phenotype (see Figure S8A, S8B). Y axis, relative ratio between GSH/GSSG levels. Data are calculated based on three independent biological repeats and statistical significance was assessed by two-sided Welch’s t-test. P = 0.0216, comparing shTF#1 to Control and P = 0.0047 comparing shTF#1 + Rescue to shTF #1. * P < 0.05; ** P < 0.01.
(G) Suppression of soft agar colony formation by Mel-167 CTCs following TF-KD by two different shRNAs (Scrambled shRNA control). The clonogenic phenotype is rescued by two lipophilic anti-oxidants, Ferrostatin-1 (0.5 μM) and Vitamin E (20 μM). Representative images for each condition are shown. Scale bar: 500 μm.
(H) Quantitation of colony formation in soft agar shown in Figure 5F. Differences between the two groups were assessed by two-sided Welch’s t-test. Statistical significance: ** P < 0.01; *** P < 0.001.
(I) Quantitation of intracellular labile free iron in Mel-167 CTCs, using flow cytometry measurements of a fluorescent reporter (Goryo chemical). The normalized geometric mean of fluorescence intensity was calculated in CTCs expressing doxycline-inducible TF after 48 hours of dox treatment. Statistical significance was assessed by two-sided Welch’s t-test. ** P < 0.01. Similar results using Mel182–2 CTCs are shown in Figure S8N.
