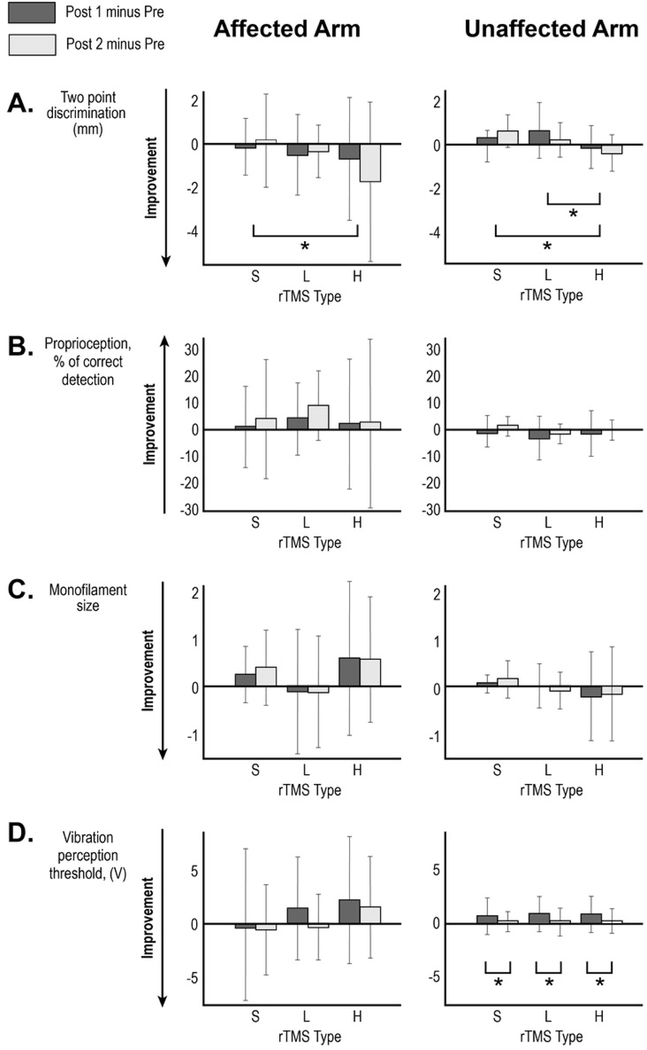
Figure 2.
Changes in clinical test scores following the three interventions performed ≥1 week apart. Mean changes for (A) two-point discrimination, (B) proprioception, (C) monofilament size and (D) vibration perception threshold at Post 1 (immediately after rTMS; dark bar) and Post 2 (1 hour after rTMS;light bar) are shown with error bar representing standard deviation. Stroke-affected arm data is in the left-sided graphs and stroke-unaffected arm is the right-sided graphs. * Brackets indicate statistically significant post-hoc paired comparisons in the mixed model analysis based on estimated marginal means. S- sham rTMS, L-low frequency rTMS, H- high frequency rTMS.

