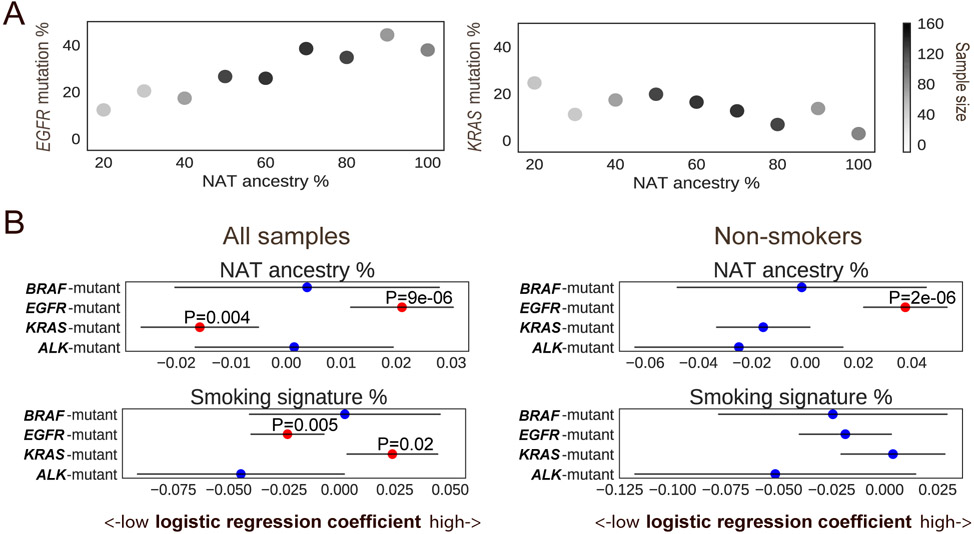
Fig. 3: Targetable LUAD driver genes associated with genetic ancestry.
A) The percentage of NAT germline ancestry is positively correlated with the percentage of somatic EGFR mutations, and negatively correlated with the percentage of somatic KRAS mutations. Color bar represents the number of samples in the NAT ancestry percentage range. B) Association of targetable LUAD driver genes with NAT ancestry, mutational signature and gender (n=705) (left), and the association in never smokers only (n=387) (right). Multivariable logistic regression P values are shown, with NAT ancestry percentage, gender, smoking and APOBEC signature as covariates. Red dots represent P value <0.05. Lines represent 95% confidence intervals.

