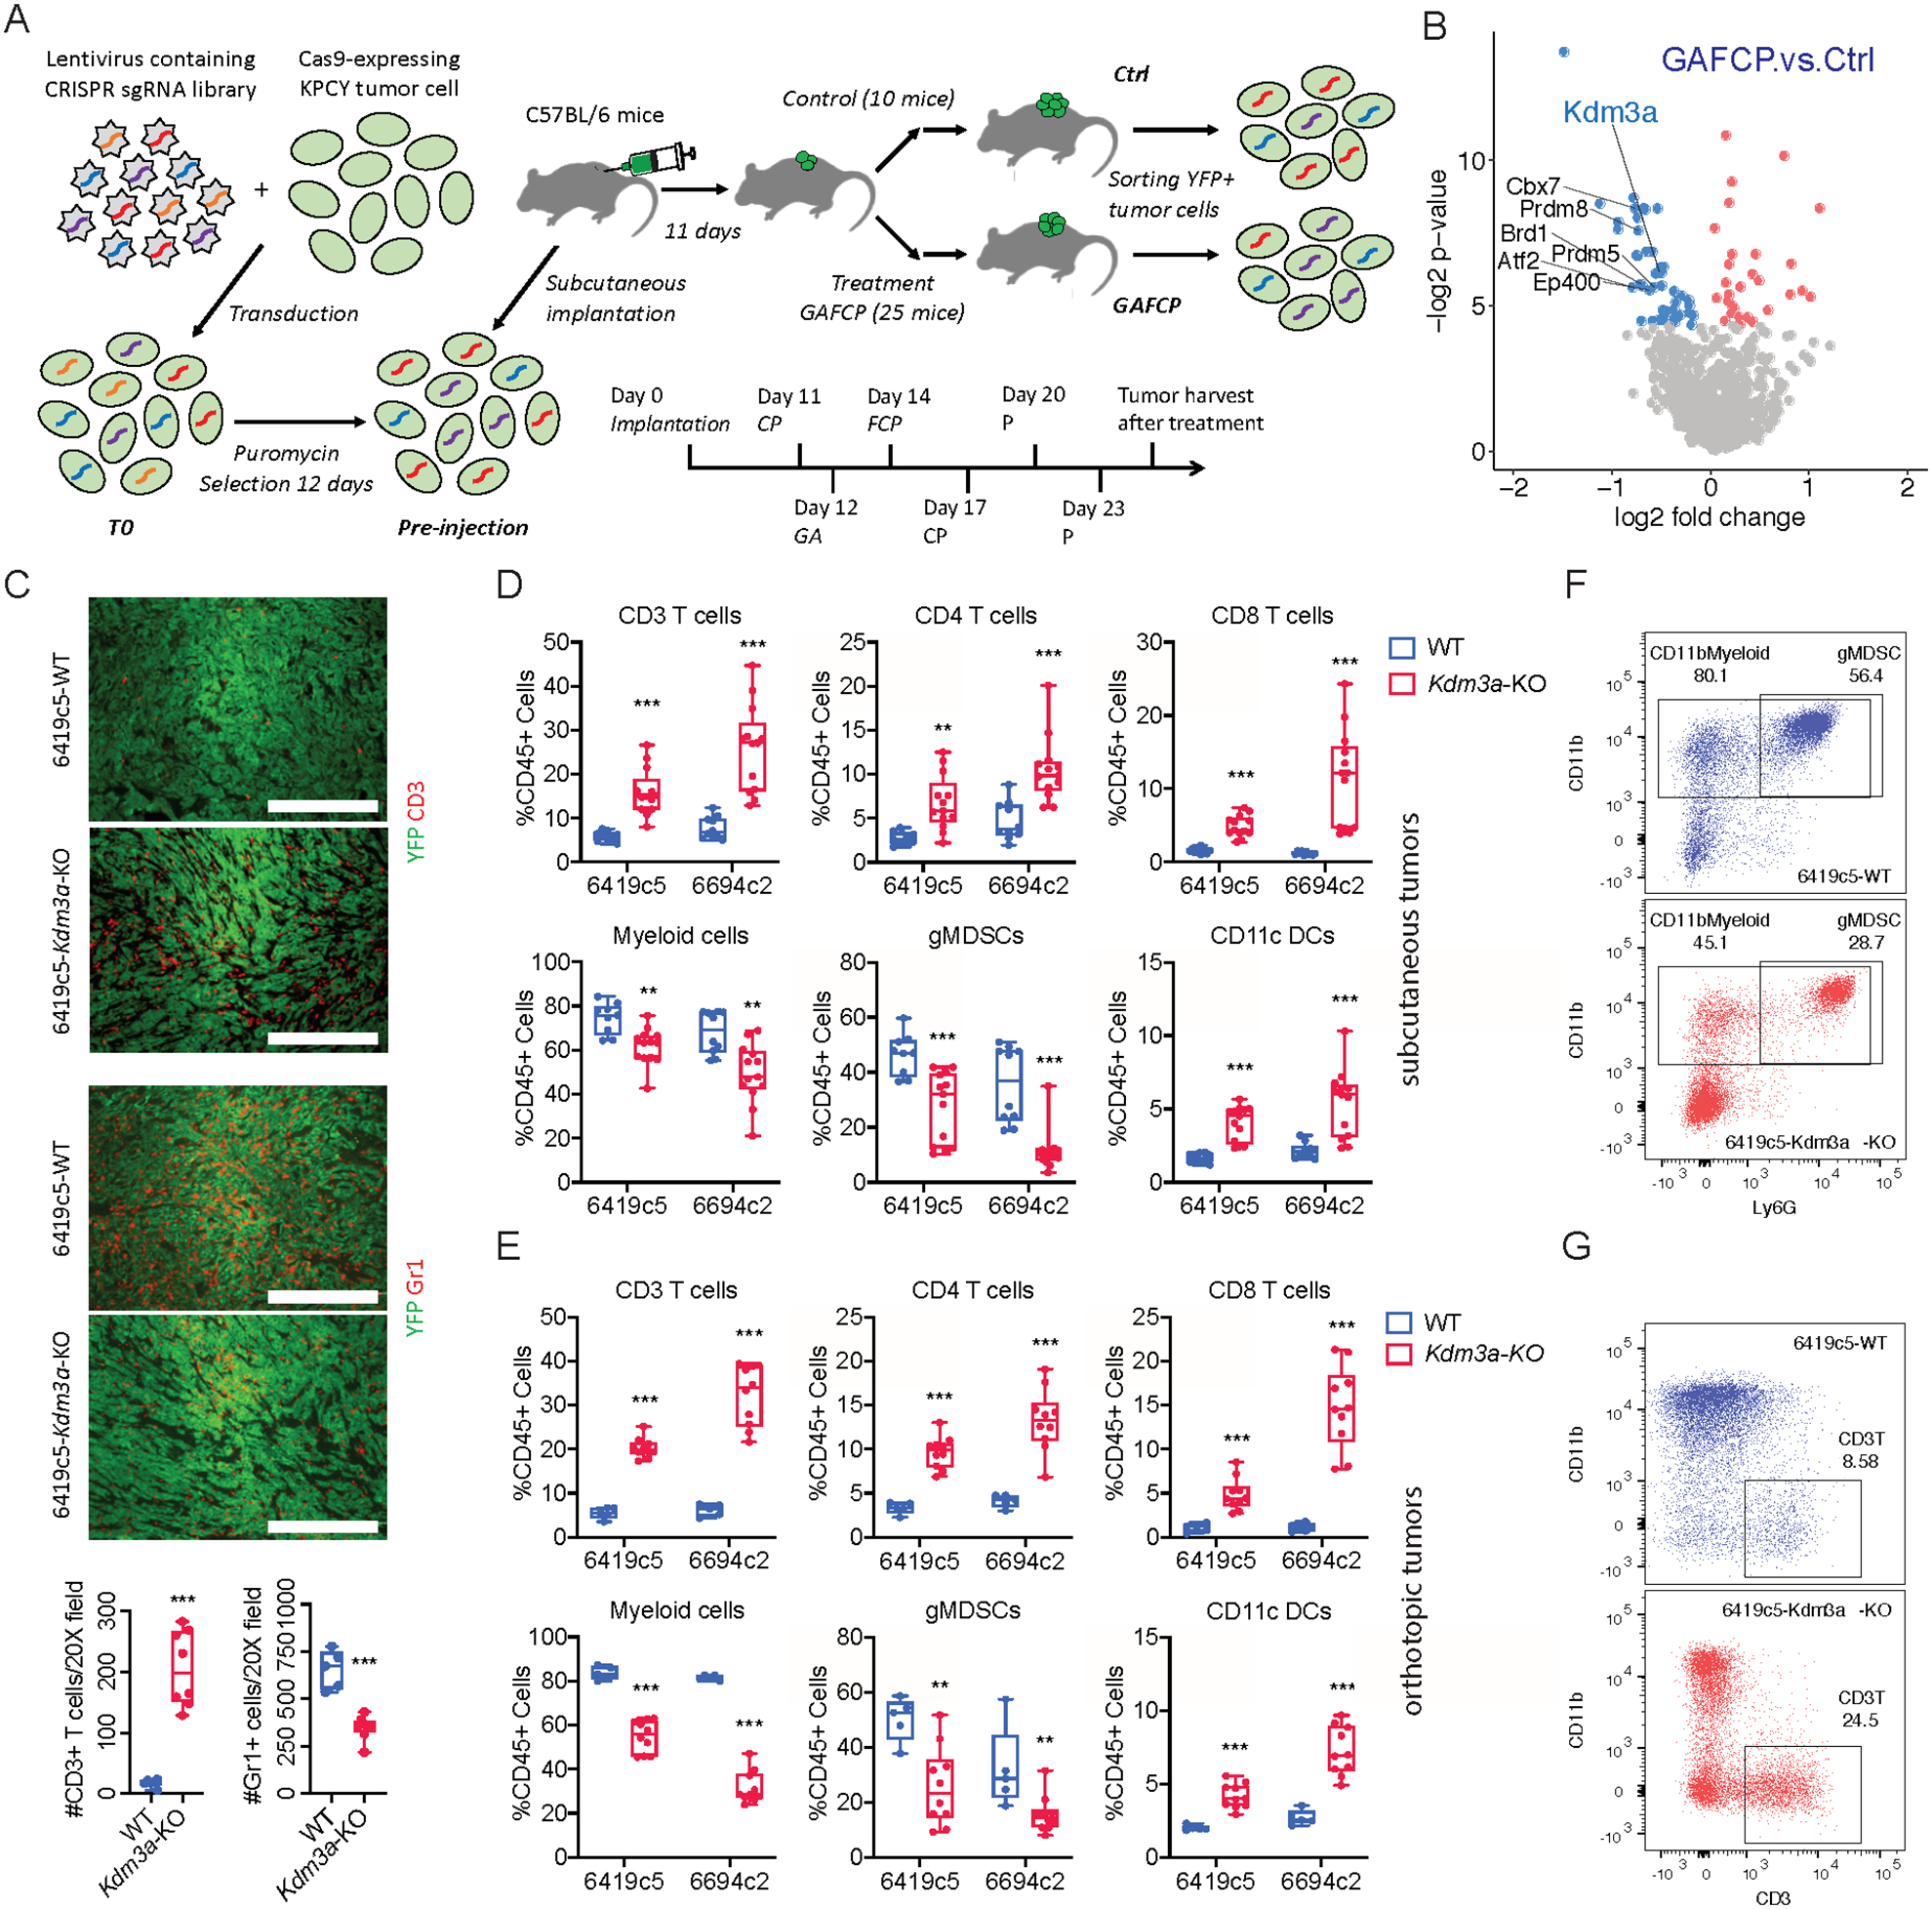
Figure 1. A genetic screen identifies KDM3A as a tumor cell intrinsic epigenetic regulator suppressing anti-tumor immunity in pancreatic cancer.

A, Diagram showing the strategy of an in vivo CRISPR-based genetic screen. B, Volcano plot showing the comparison between GAFCP and Ctrl groups. Each dot represents a gene whose sgRNAs were enriched in Ctrl (blue) or GAFCP (red) groups, with p-value < 0.05. Top candidate epigenetic regulators whose sgRNAs were enriched in the Ctrl group (p-value < 0.025 and >3 sgRNAs meeting a statistical cutoff) are highlighted. C, Top: representative immunofluorescent staining images of CD3+ T cells and Gr1+ myeloid cells in Kdm3a-WT or Kdm3a-KO tumors stained for CD3 or Gr1 (red) and YFP (green). Bottom: quantification of CD3+ T cells and Gr1+ myeloid cells comparing Kdm3a-WT and Kdm3a-KO tumors (counts taken from n=5–8 images/group; data combined from two independent 6419c5 knockout clones). D, Flow cytometric analysis of tumor infiltrating immune cells in subcutaneously implanted Kdm3a-WT and Kdm3a-KO 6419c5 and 6694c2 tumors (n=9–13/group). E, Flow cytometric analysis of tumor infiltrating immune cells in orthotopically implanted Kdm3a-WT and Kdm3a-KO 6419c5 and 6694c2 tumors (n=5–10/group). F-G, Representative flow plots showing the abundance of myeloid cells (F) and T cells (G) within total CD45+ leukocytes in Kdm3a-WT (blue) or Kdm3a-KO (red) tumors. In C, statistical differences were calculated using unpaired Student’s t-test. In D-E, statistical differences were calculated using Multiple T test. p<0.05 was considered statistically significant, * indicates p<0.05, ** p<0.01, and *** p< 0.001.
