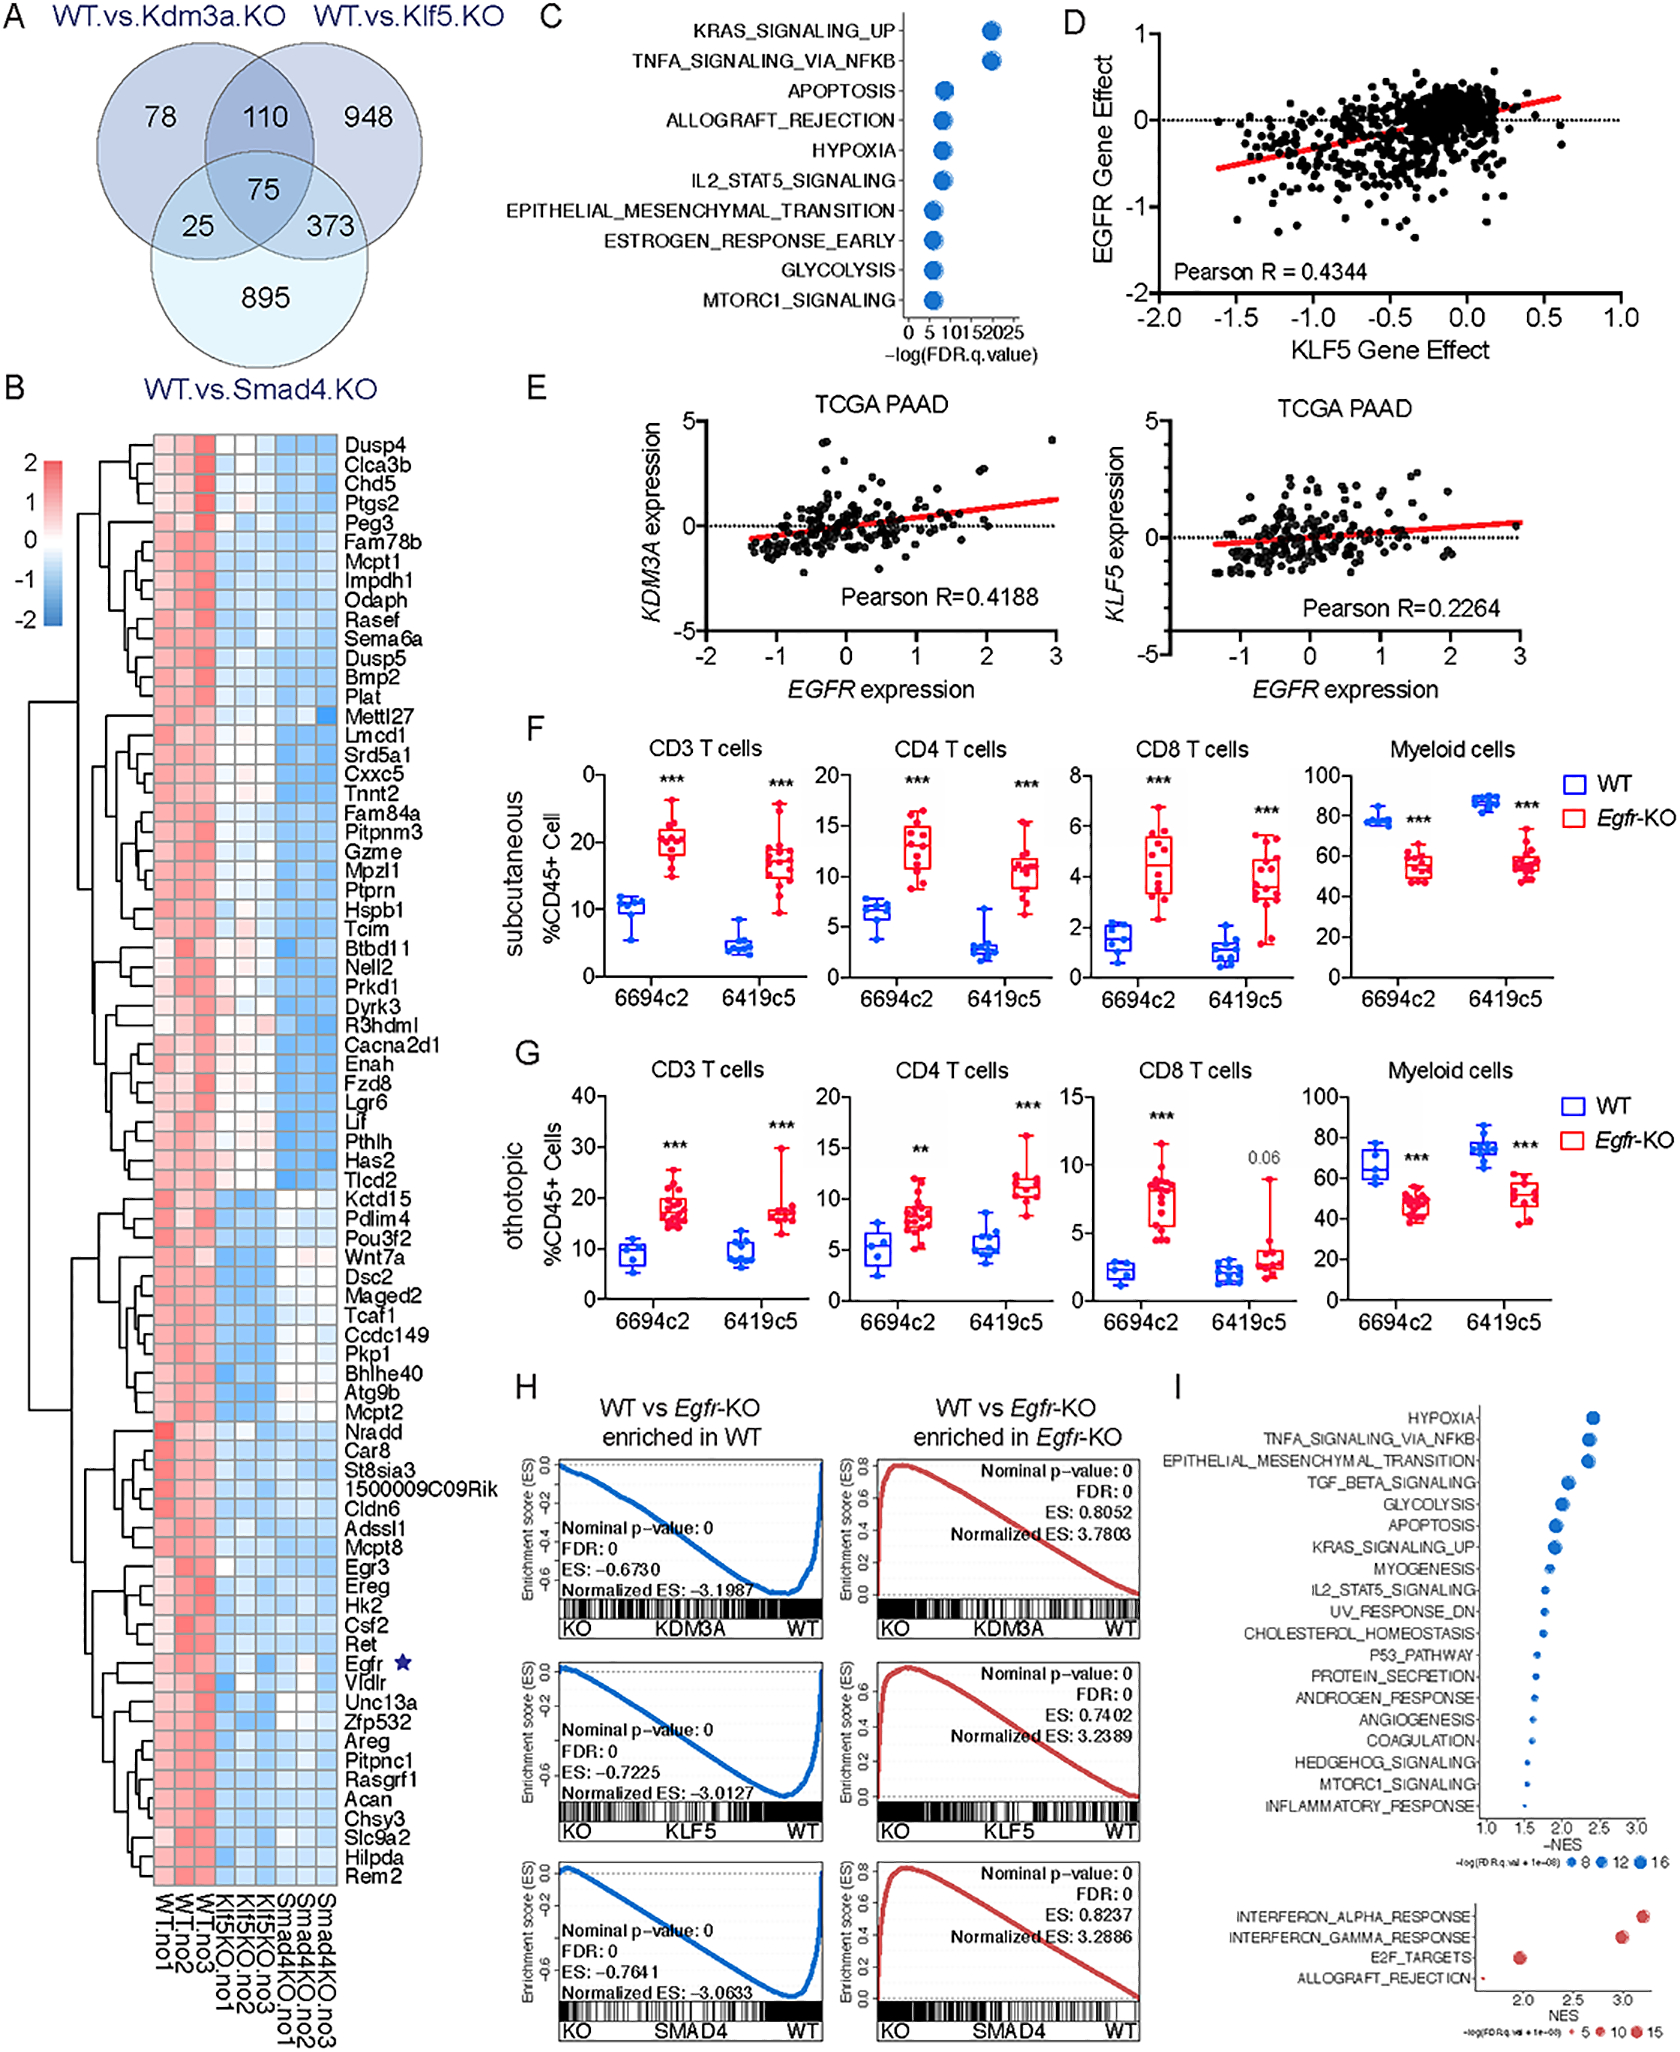
Figure 5. Molecular profiling identifies EGFR as a tumor cell intrinsic factor regulating the immune TME and sensitivity to combination immunotherapy in PDA.

A, Venn diagram showing the overlap of differentially expressed genes in Klf5-KO, Kdm3a-KO, and Smad4-KO tumor cells compared to WT. B, Heatmap showing expression of the 75 overlapped genes in A. C, Graph showing the top enriched hallmark genesets based on the GSEA of overlapped genes identified in A. D, Dot plot showing the dependency scores for EGFR and KLF5 across all tumor cell lines in the Project Achilles/Cancer Dependency Map Portal (DepMap). E, Dot plot showing the expression of EGFR, KDM3A and KLF5 in the TCGA PAAD dataset. F, Flow cytometric analysis of immune cells in subcutaneously implanted WT and Egfr-KO 6419c5 and 6694c2 tumors (n=7–16/group, 2 knockout clones from each parental tumor cell clone). G, Flow cytometric analysis of immune cells in orthotopically implanted WT and Egfr-KO 6419c5 and 6694c2 tumors (n=5–18/group, 2 knockout clones from each parental tumor cell clone). H, Leading-edge plots from the GSEA analysis highlighting the enrichment of EGFR gene signature based on RNA-seq analysis of Kdm3a-KO, Klf5-KO, and Smad4-KO tumor cells (gene signatures were generated based on p.adj-value < 0.01 and fold change > 2). I, Graph showing top enriched functional pathways from GSEA using Hallmark genesets. In F-G, statistical differences were calculated using Multiple T test. p<0.05 was considered statistically significant, * indicates p<0.05, ** p<0.01, and *** p< 0.001.
