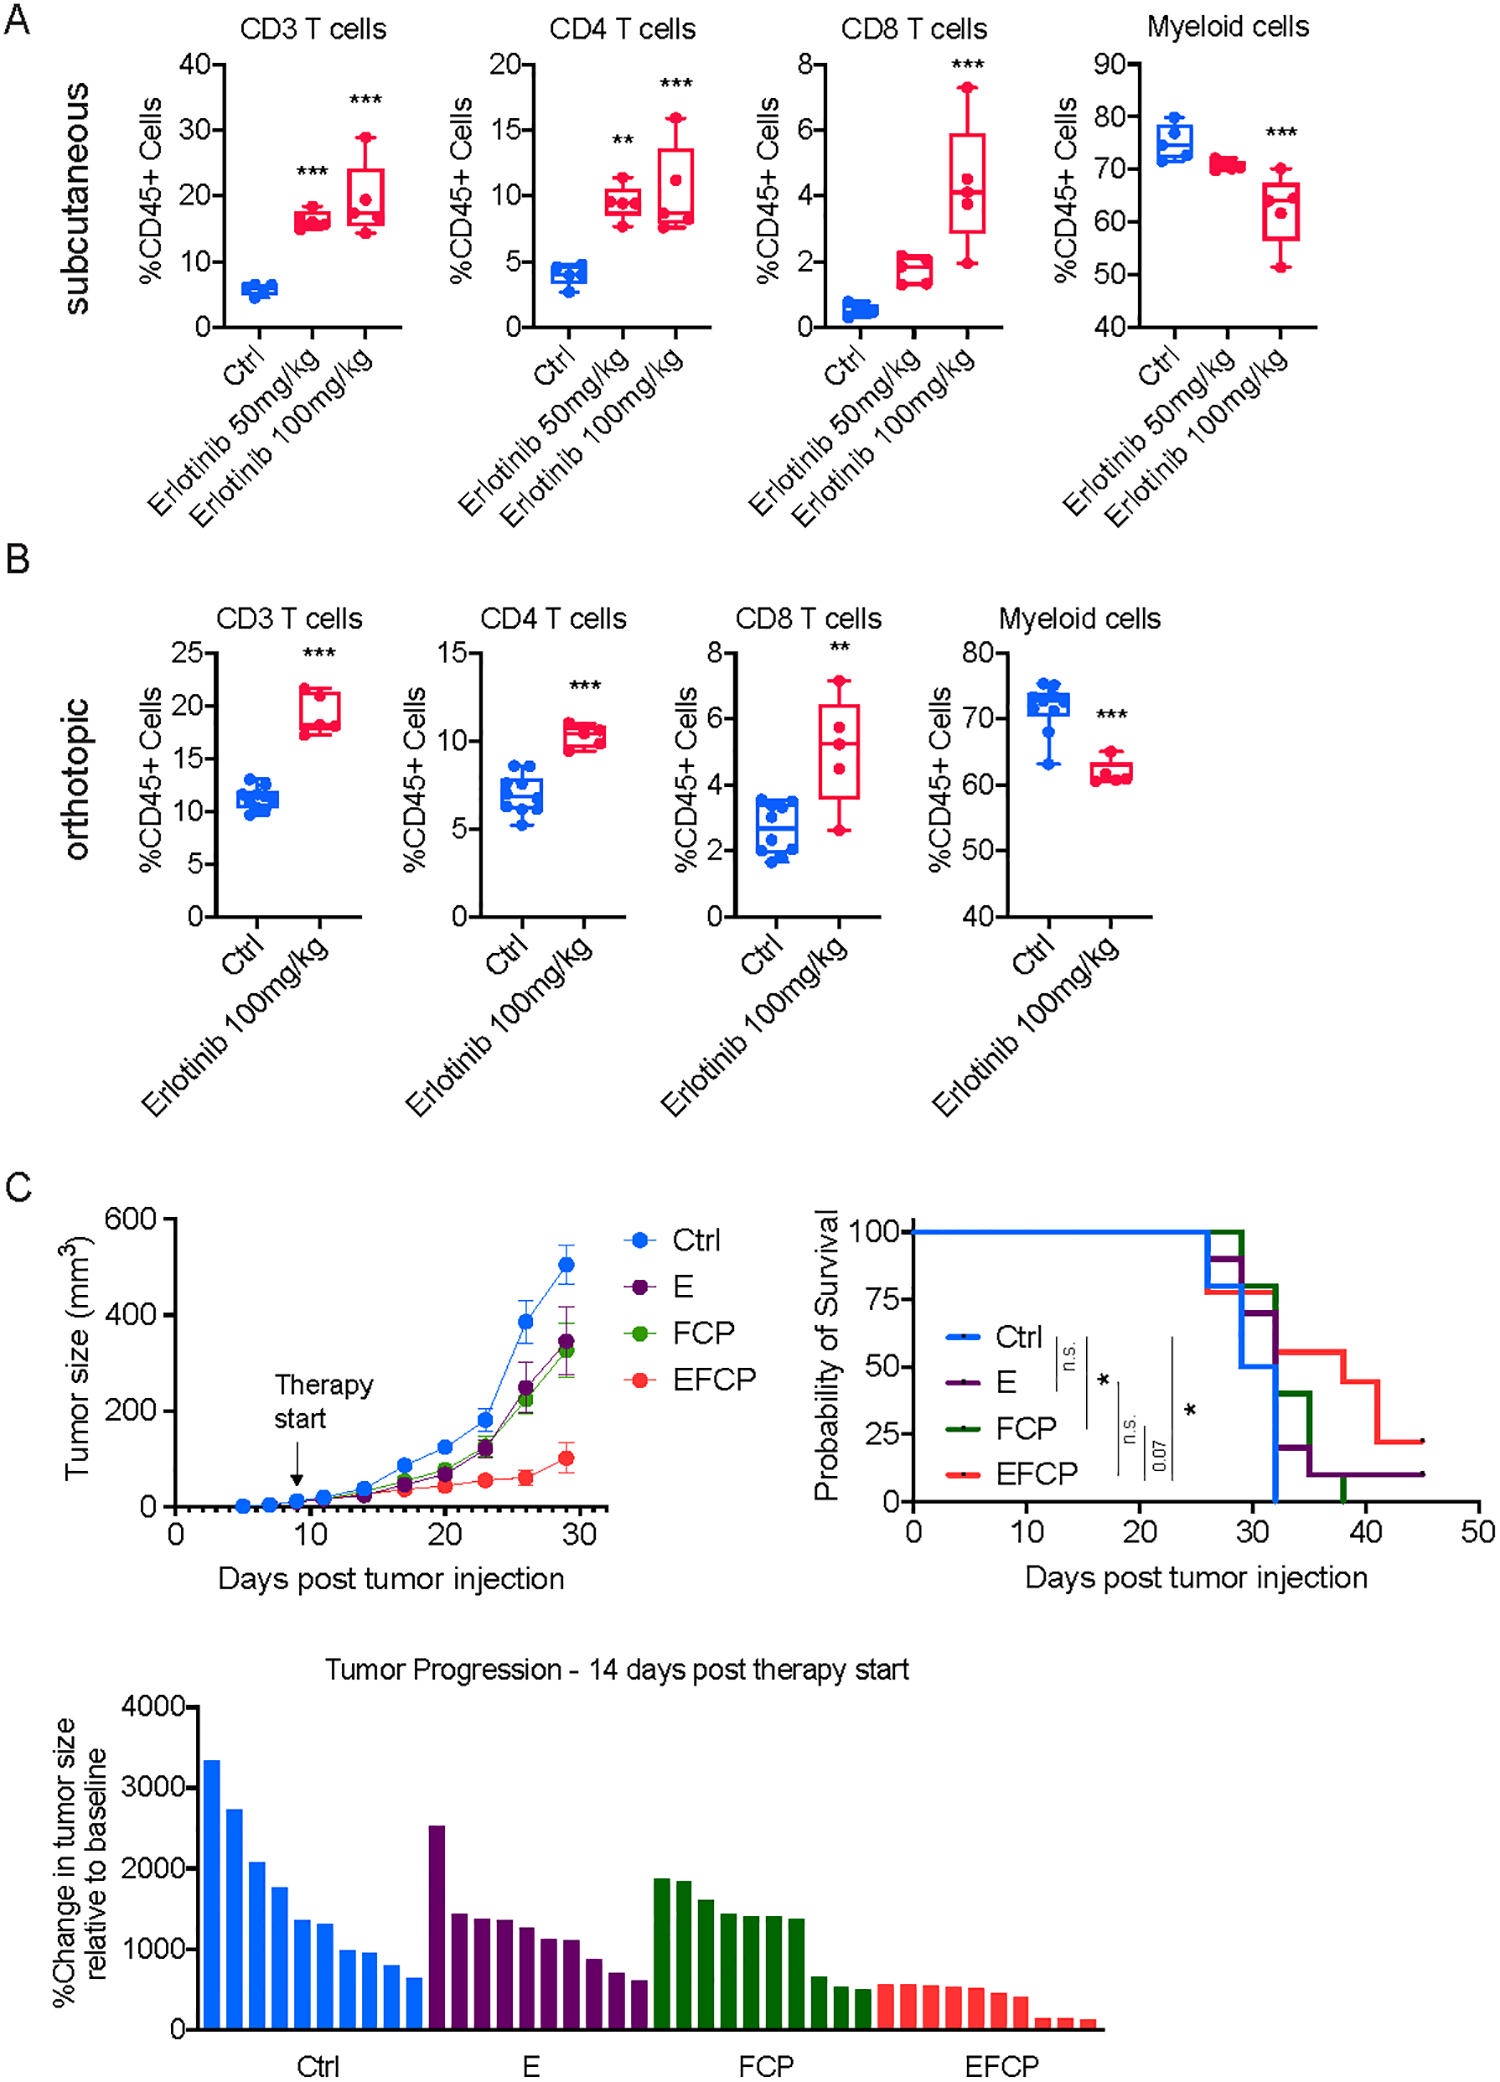
Figure 7. Erlotinib treatment increases T cell infiltration in PDA tumors and enhances the sensitivity of PDA tumors to a combination immunotherapy.

A, Flow cytometric analysis of immune cells in subcutaneously implanted 6694c2 tumors treated with either vehicle or erlotinib (n=5/group). B, Flow cytometric analysis of immune cells in orthotopically implanted 6694c2 tumors treated with either vehicle or erlotinib (n=5/group). For subcutaneous tumors, treatment started on day 10 post-implantation, and tumors were collected for flow analysis 10 days later. For orthotopic tumors, treatment started on day 7 post-implantation and tumors were harvested for flow analysis 10 days later. C, Growth curve, overall survival curve, and waterfall plot showing change in tumor size relative to the start of treatment of tumors from a non-T-cell-inflamed tumor cell clone, 6694c2, treated with vehicle, erlotinib (E), FCP, or erlotinib combined with FCP treatment (EFCP). In A, statistical differences were calculated using one-way ANOVA with multiple comparisons. In B, statistical differences were calculated using unpaired Student’s t-test. In C, statistical differences were calculated using two-way ANOVA with multiple comparisons and Log-rank (Mantel-Cox) test. p<0.05 was considered statistically significant, * indicates p<0.05, ** p<0.01, and *** p< 0.001.
