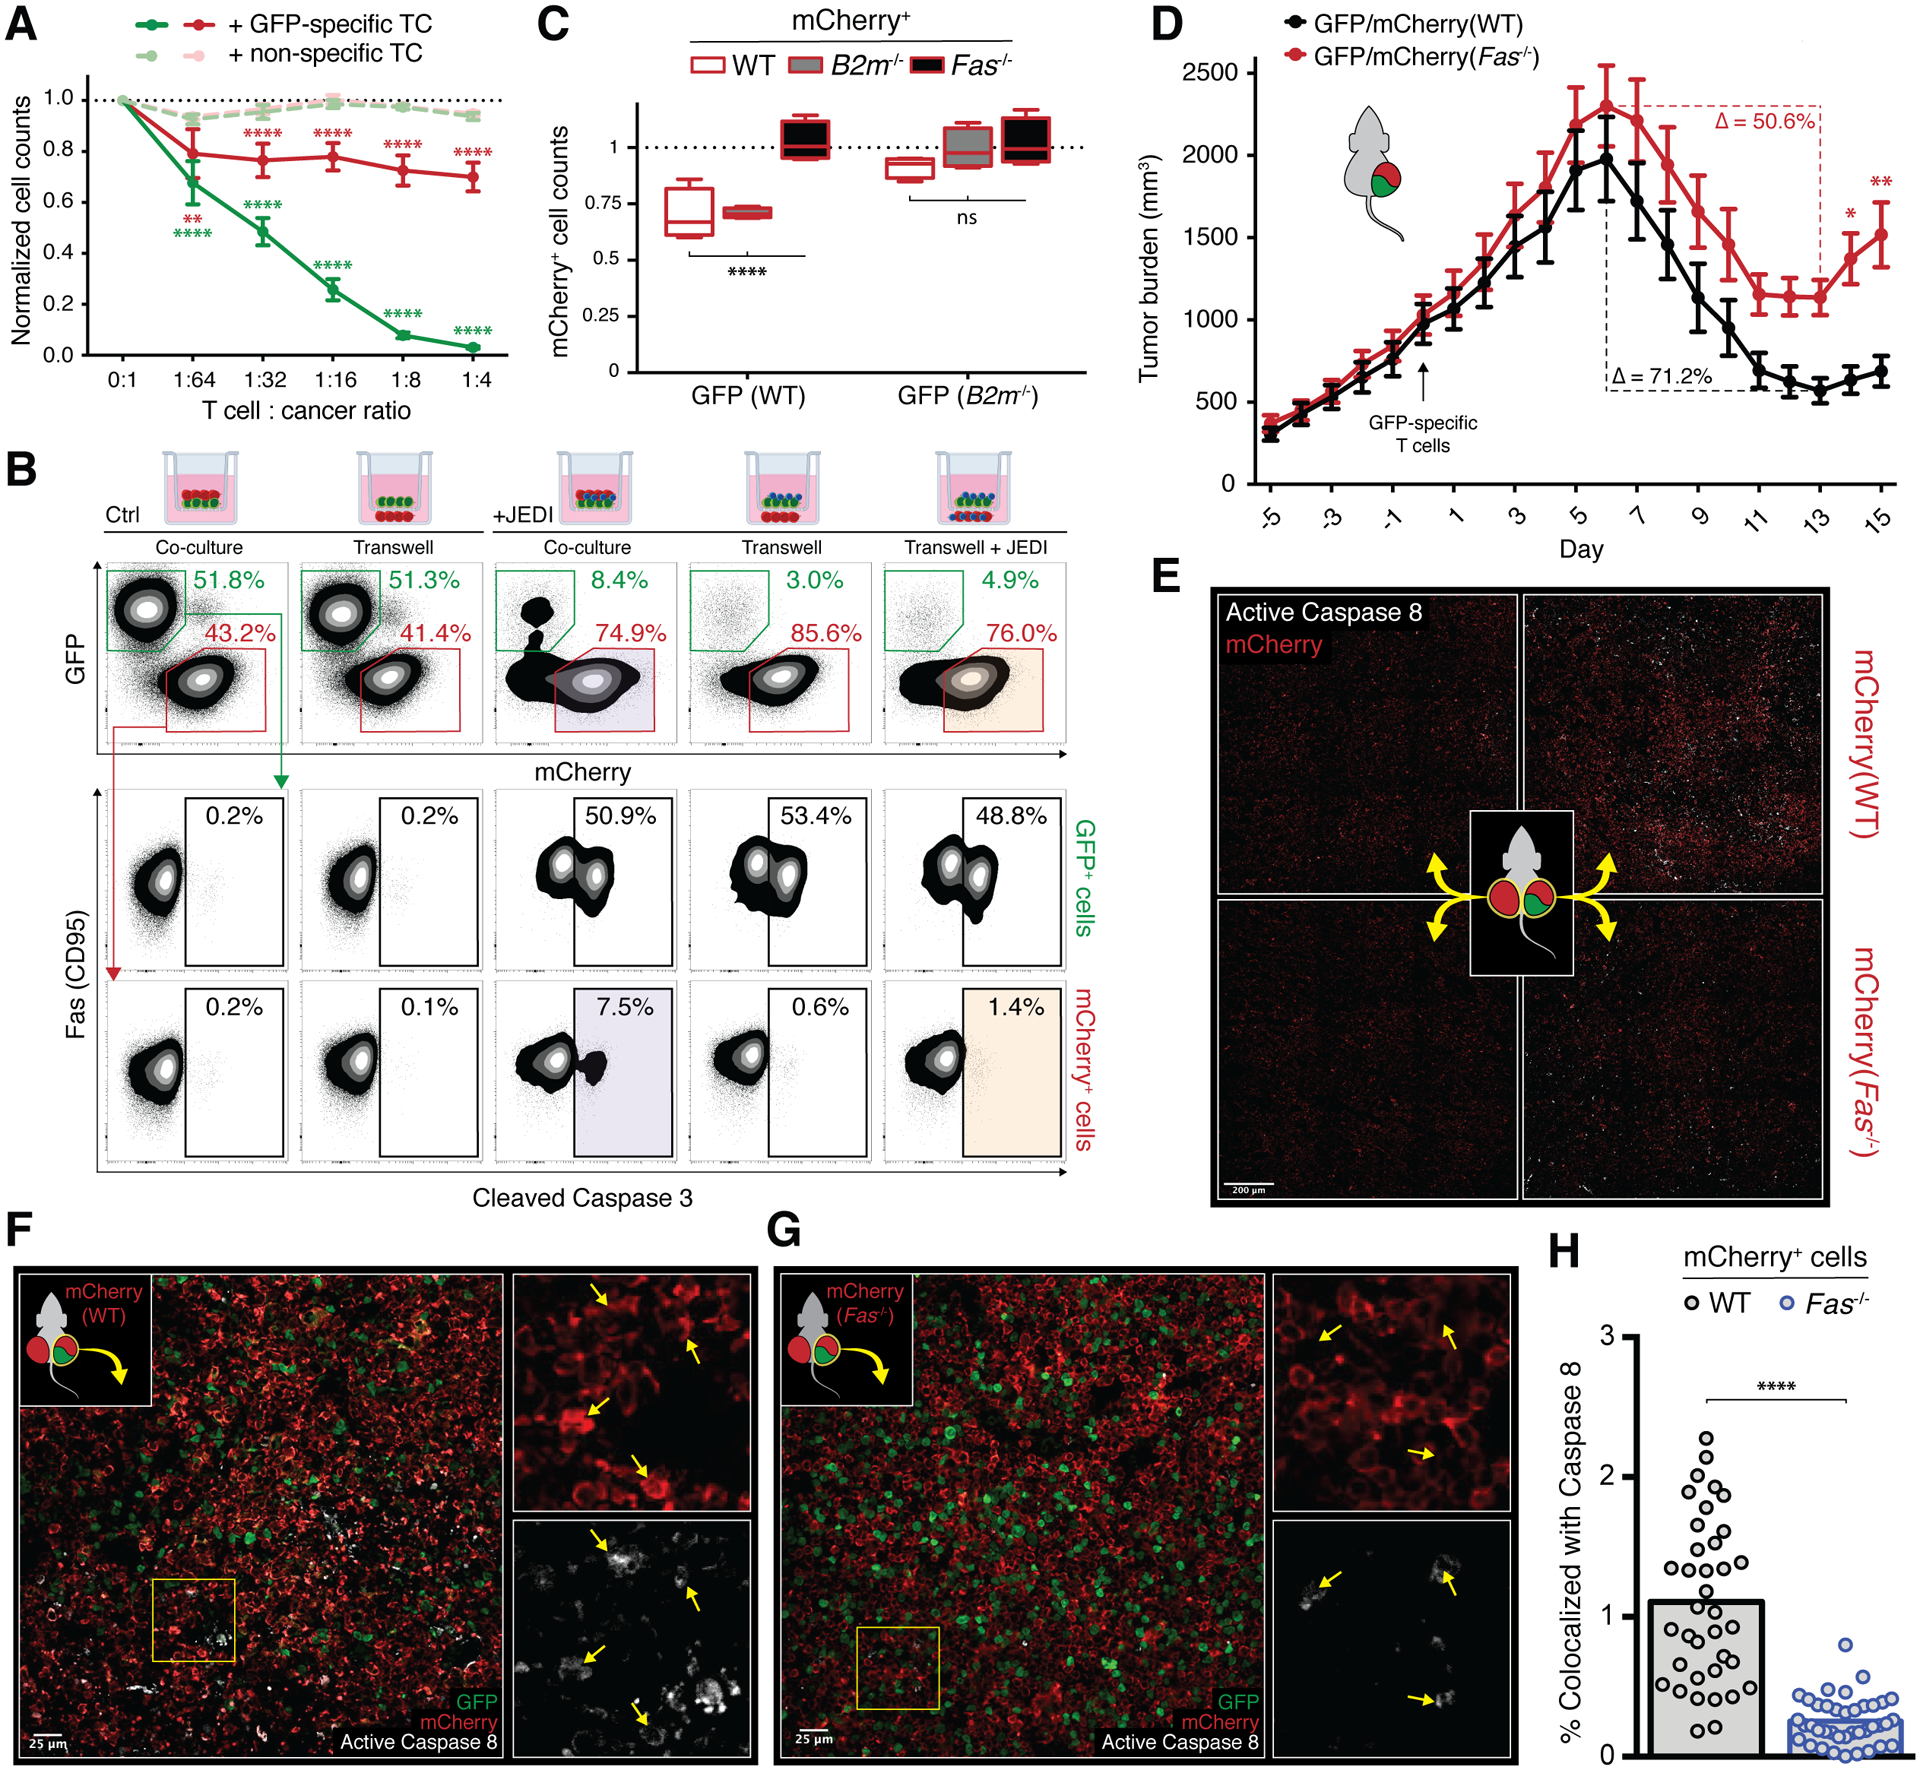
Figure 2. Fas mediates geography-dependent off-target bystander killing of Ag− tumor by Ag-specific CD8 T cells.

A, Cell counts of WT GFP+ (green) and WT mCherry+ (red) cells co-cultured with FACS purified tetramer+ (dark, GFP-specific) or tetramer− (light, non-specific) activated CD8 T cells at indicated ratios; counts relative to beads and normalized to 0:1 condition; error bars presented as mean ± SEM; two-way ANOVA with Sidak correction for multiple comparisons, **p<0.01, ****p<0.0001 (n=4). B, Representative cleaved caspase 3 staining of GFP+ cells (middle row) and mCherry+ cells (bottom row) after co-culture with activated JEDI T cells in transwell configurations (top row, from left to right: GFP+ and mCherry+ in top chamber; GFP+ in top chamber / mCherry+ in bottom chamber; GFP+, mCherry+, and JEDI in top chamber; GFP+ and JEDI in top chamber / mCherry+ in bottom chamber; GFP+ and JEDI in top chamber / mCherry+ and JEDI in bottom chamber). C, Normalized cell counts of WT (white), B2m−/− (gray), or Fas−/− (black) mCherry+ cells when co-cultured with WT (left panel) or B2m−/− (right panel) GFP+ cells in the presence of JEDI T cells; boxplots presented as minimum to maximum; two-way ANOVA with Sidak correction for multiple comparisons, ****p<0.0001 (n=4). D, Growth of mixed tumors with 50% WT GFP+ cells and 50% WT mCherry+ (black) or Fas−/− mCherry+ (red) cells in Rag1−/− mice adoptively transferred with tetramer-sorted GFP-specific CD8 T cells (arrow); percent change from maximum (day 6) to minimum (day 13) of each curve indicated; error bars presented as mean ± SEM; two-way ANOVA with Sidak correction for multiple comparisons, *p<0.05, **p<0.01 (n=9 mice/group; pooled from 2 independent experiments). Individual tumor curves in Supplemental Fig. S3D. E, Tiled confocal IF of tumors from mice bearing mixed primary GFP+/mCherry+ tumors (right column) and distant secondary mCherry+ tumors (left column) with either WT (top row) or Fas−/− (bottom row) mCherry+ cells; tumors cryopreserved on days 6–8 after adoptive transfer of tetramer-sorted GFP-specific CD8 T cells (Supplementary Fig. S3F). F–G, Higher power images of primary GFP+/mCherry+ tumors with either WT (F) or Fas−/− (G) mCherry+ cells from E (right column) with insets showing magnified single channel images of area outlined in yellow; arrows point to areas of active caspase 8 staining (bottom insets) and corresponding areas of mCherry staining (top insets). H, Quantification of percent area of mCherry staining that is colocalized with active caspase 8 staining from 37–39 fields of view as shown in F and G; unpaired two-tailed t test, ****p<0.0001 (n=3–5 mice/group, pooled from 3 independent experiments).
