
Figure 10.
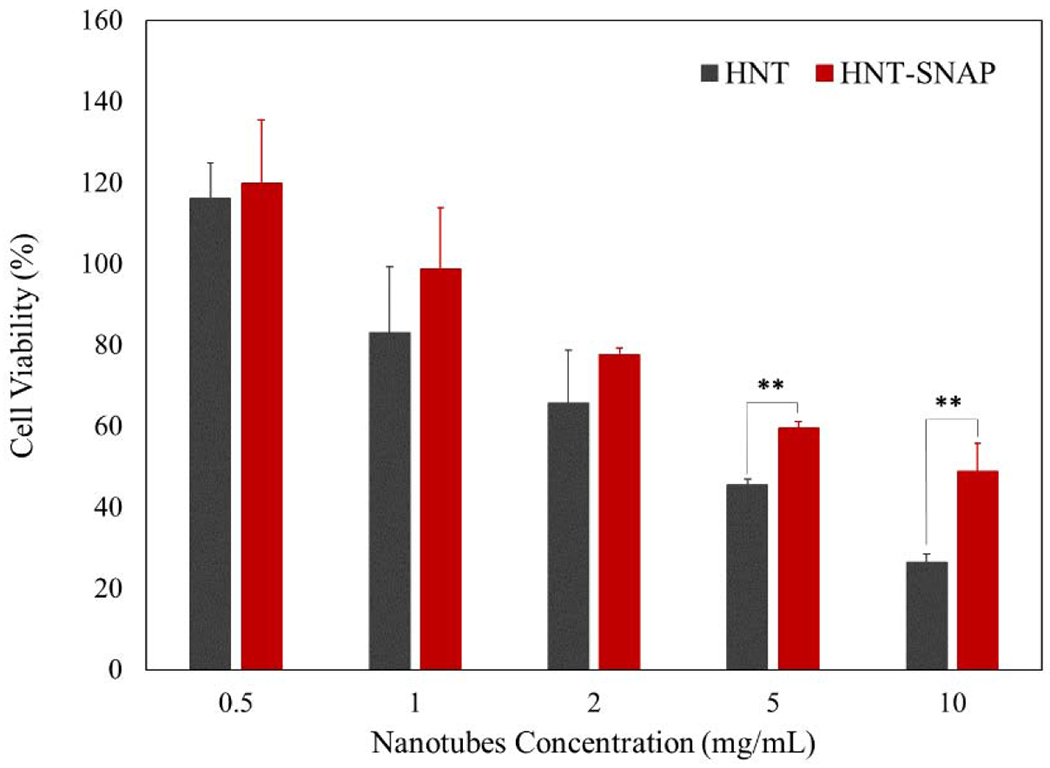
24 h viability of 3T3 mouse fibroblast cells (as a percentage relative to control) using WST dye-based CCK-8 assay. The error bar represents the SD (n=6). p-values ≤ 0.01 are shown with **.
Official websites use .gov
A
.gov website belongs to an official
government organization in the United States.
Secure .gov websites use HTTPS
A lock (
) or https:// means you've safely
connected to the .gov website. Share sensitive
information only on official, secure websites.
24 h viability of 3T3 mouse fibroblast cells (as a percentage relative to control) using WST dye-based CCK-8 assay. The error bar represents the SD (n=6). p-values ≤ 0.01 are shown with **.