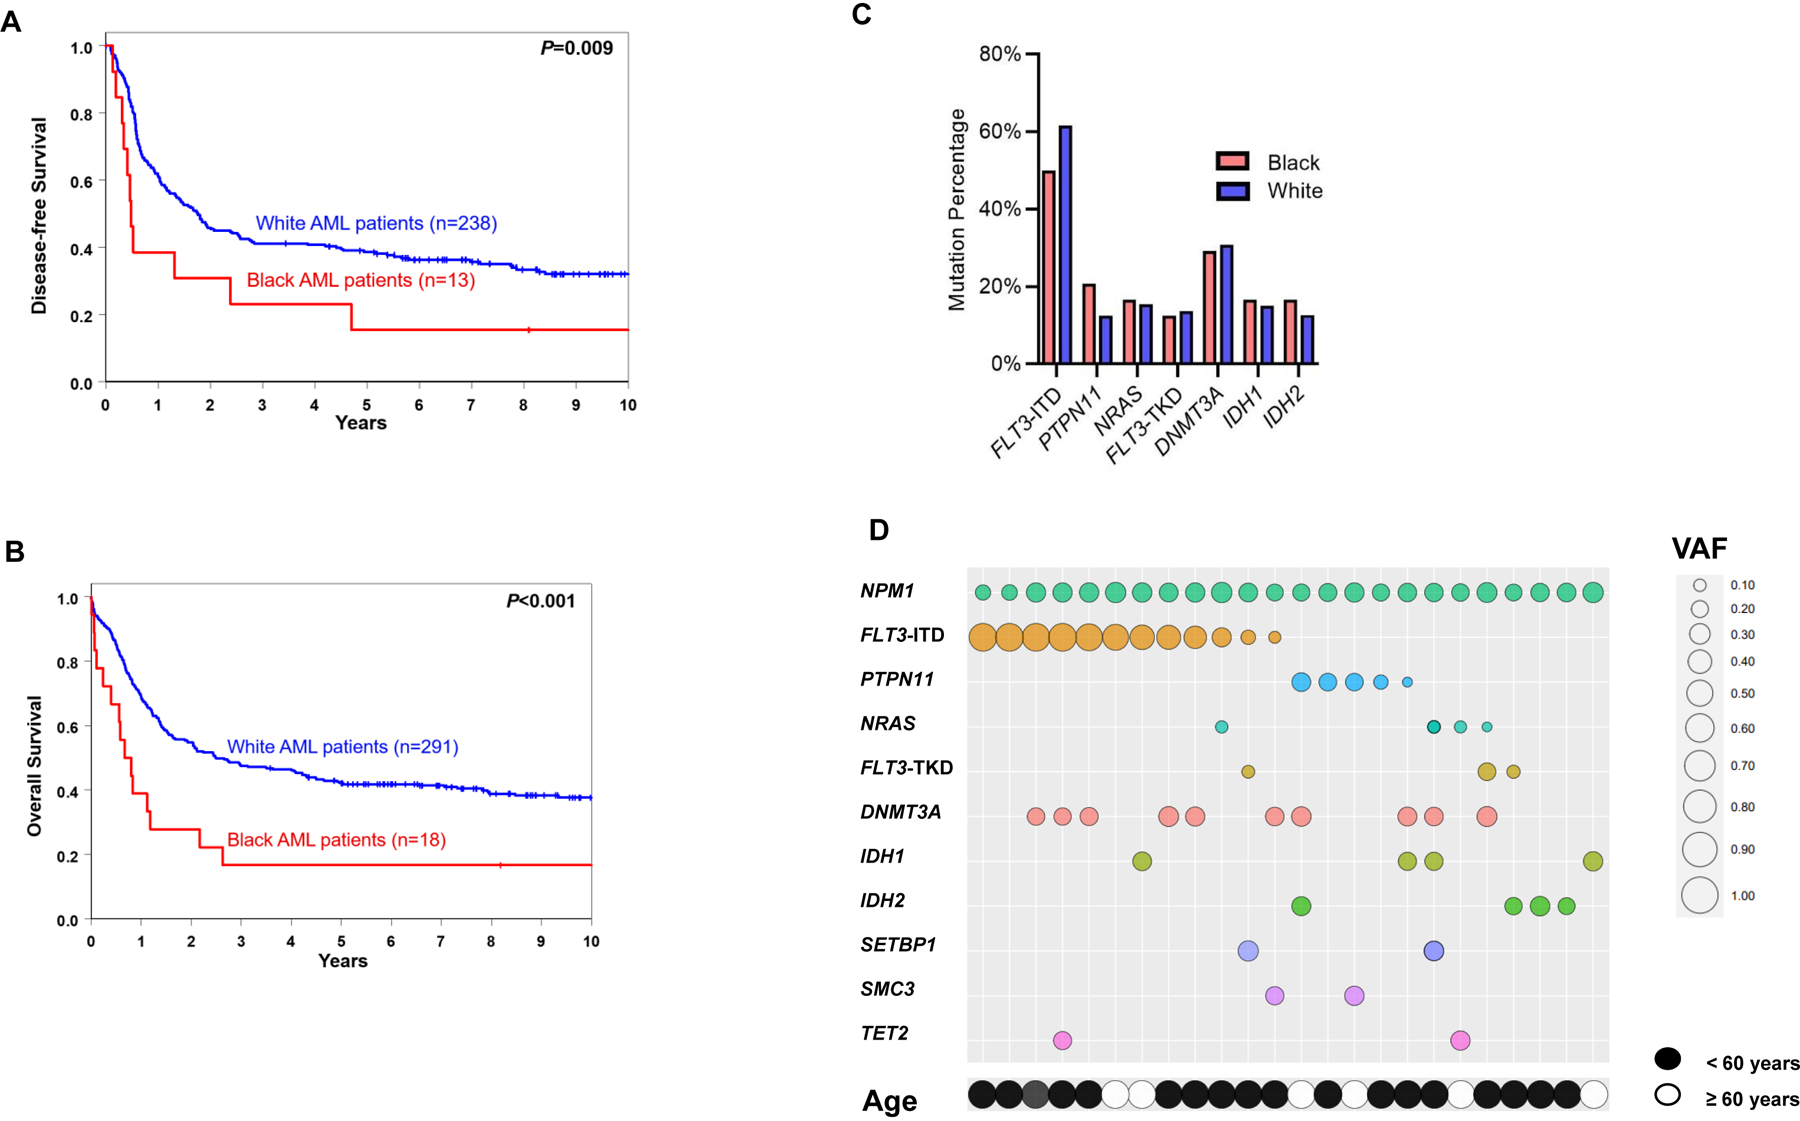
Figure 3.

Treatment outcome of Black and White patients with AML aged <60 years who were treated on the CALGB/Alliance study protocols. A, disease-free and B, overall survival within NPM1-mutated of Black and White patients. C, bar graph depicting frequencies of mutations co-existing with NPM1 mutation in Black and White patients with AML. D, a bubble plot with co-occurring mutations and associated variant allele frequencies (VAF) observed in NPM1-mutated Black AML patients treated on CALGB/Alliance studies. Increased bubble sizes indicate higher VAFs/allelic ratio (for FLT3-ITD). Each column refers to one individual patient.
