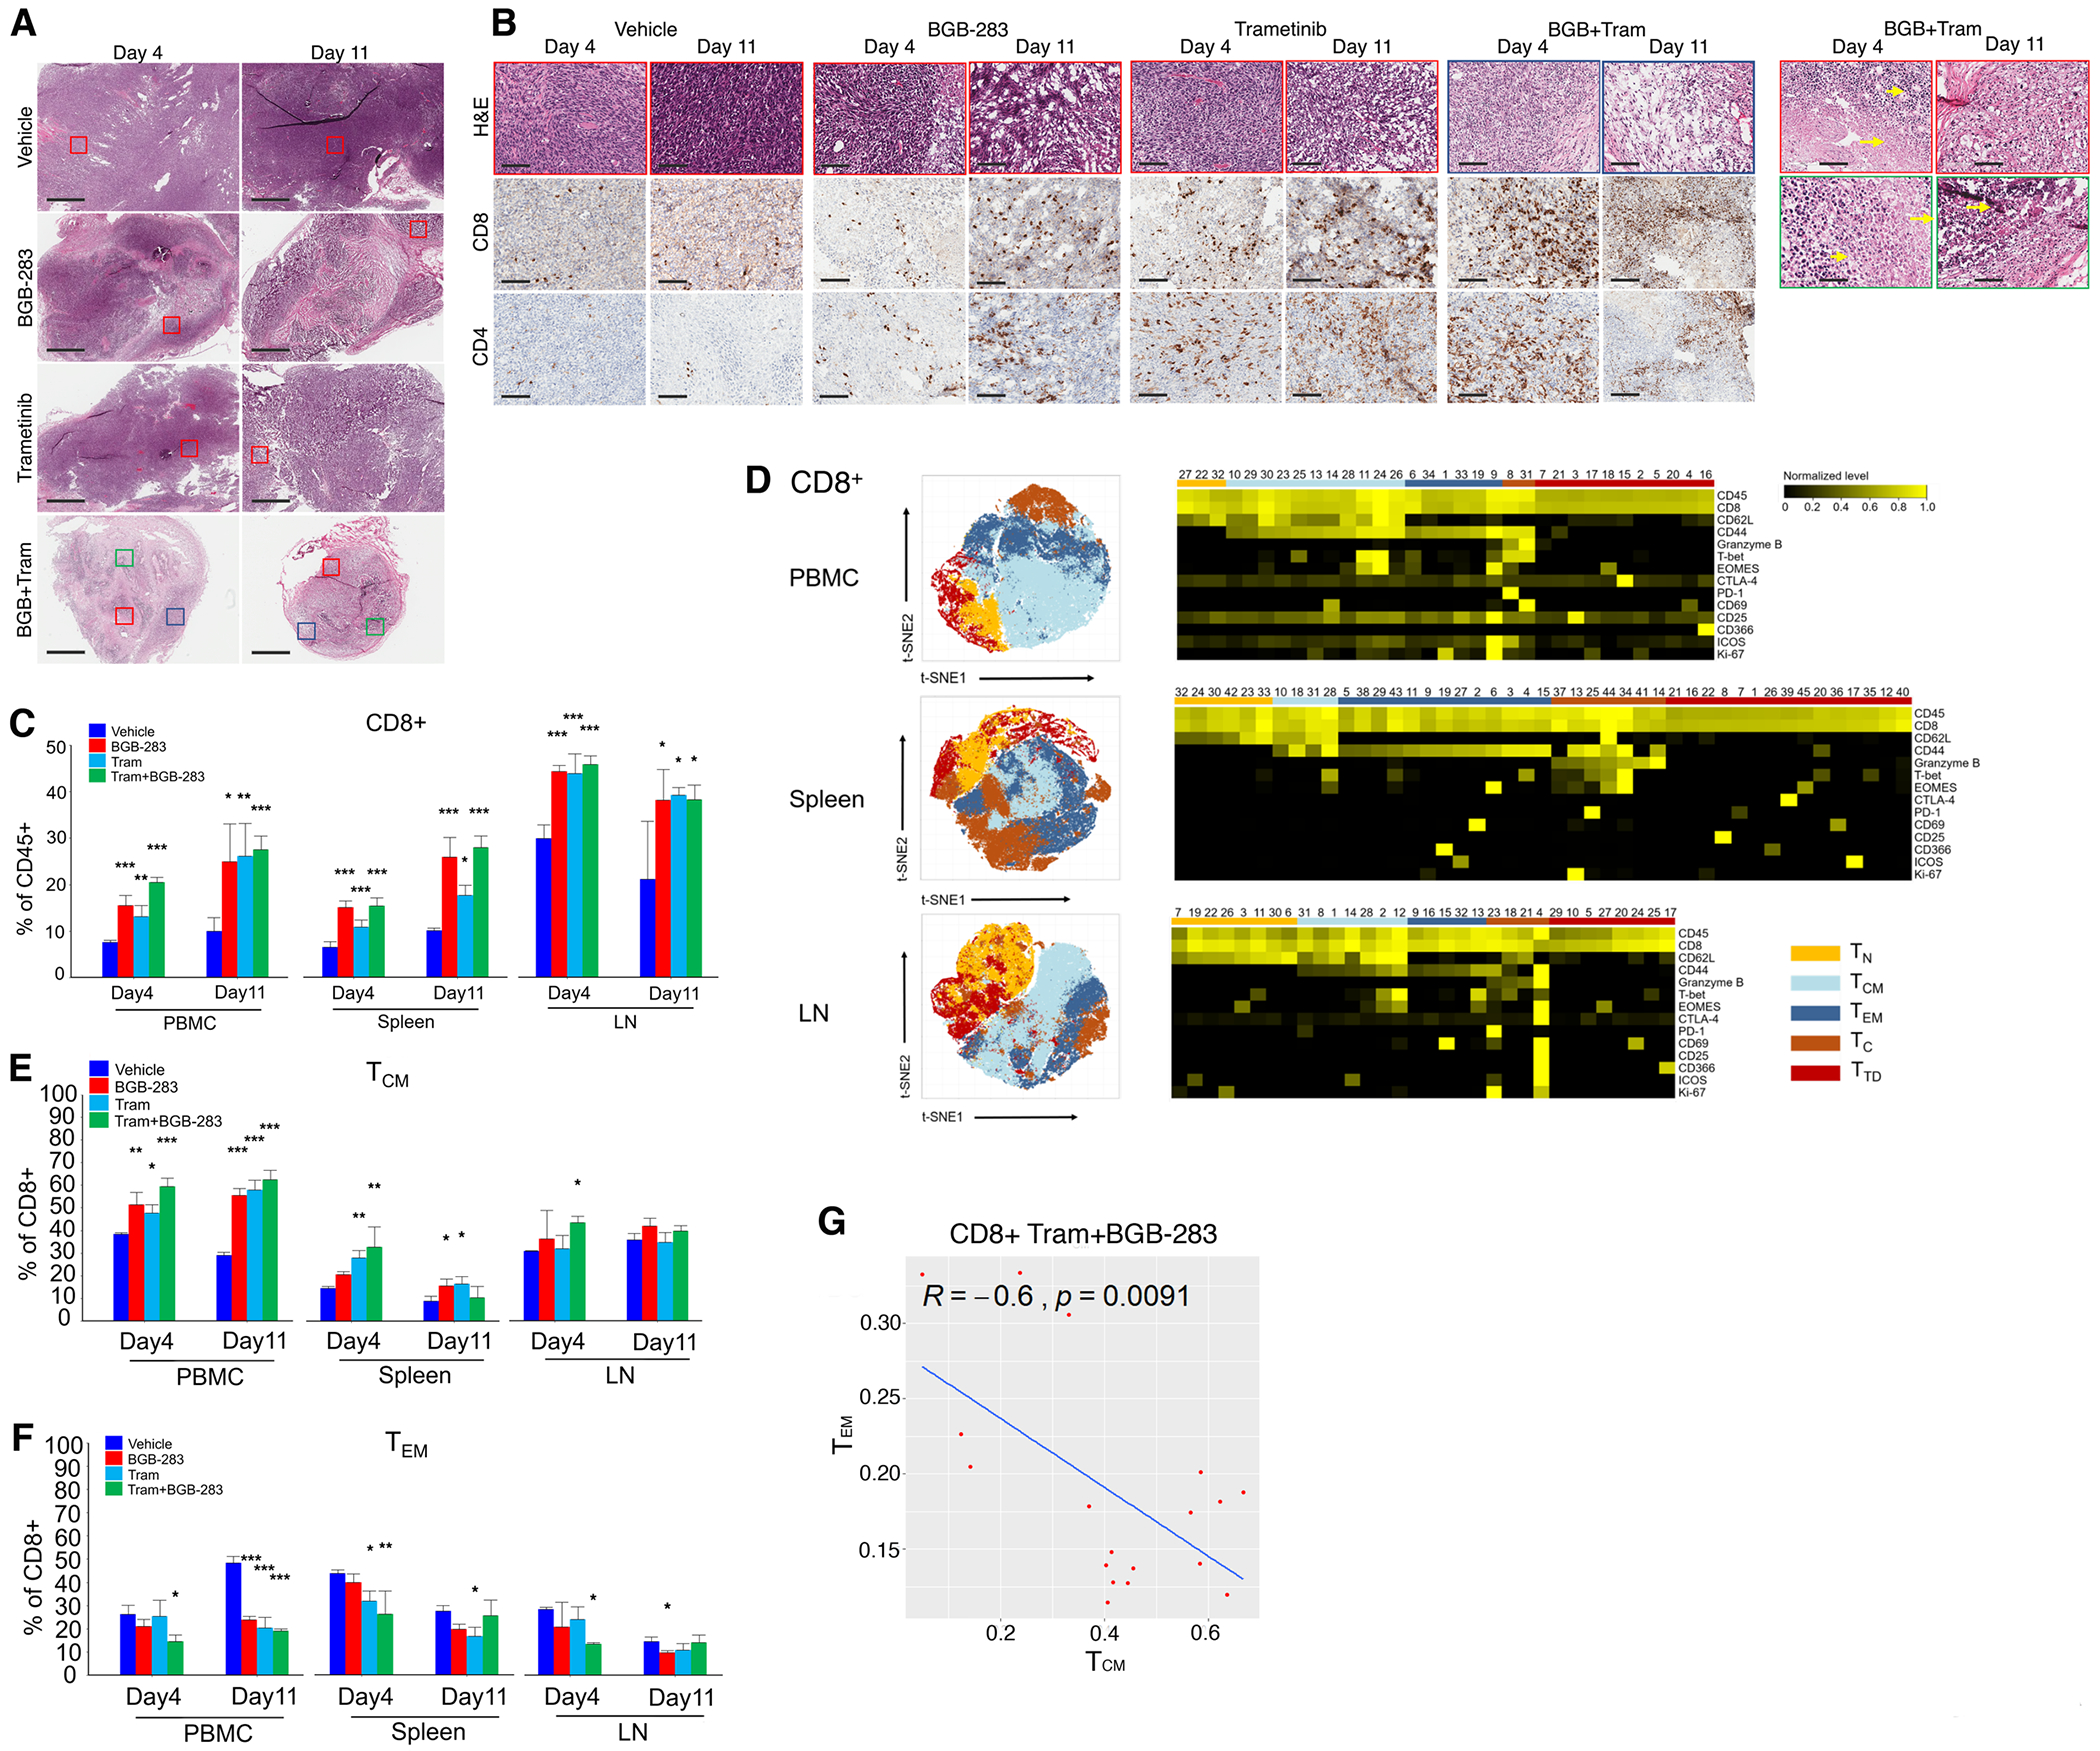
Figure 6.

Type II RAFi+MEKi elicits systemic expansion of central memory CD8+ T-cells in mice-bearing NrasMUT melanoma.
A, Hematoxylin and eosin (H&E) stains of NILER1–4 tumors (days 4 and 11) on vehicle, BGB-283 (20 mg/kg/d), trametinib (1 mg/kg/d), or both. Representative of three tumors per group. Ruler=1 mm. Colored boxes delineate magnified areas in e.
B, Magnified areas of NILER1–4 tumors analyzed by H&E and representative CD8 and CD4 immnuohistochemistry. Ruler=100 μm. Highlighted H&E images of BGB+tram-treated tumors show areas of inflammation (short arrows), necrosis (long arrows), apoptotic bodies (d11, top) and tumor regression with melanosis (d11, bottom).
C, Indicated tissue samples (PBMC, spleen, draining lymph nodes or LNs; n=3 per site) were obtained for CyTOF analysis on days 4 and 11 after starting each treatment group. Frequencies of CD4+ or CD8+ T-cells. Mean ± SEMs. Pairwise group comparisons with respect to the vehicle-treated group. P-value, paired Student’s t test. *p<0.05, **p<0.01 and ***p <0.001.
D, t-SNE maps (left) of CD8+ T-cell subsets (within CD45+ cells) in the PMBC, spleen and draining LNs analyzed by CyTOF (pooled data from days 4 and 11). Heatmaps (right) showing the expression values of immune phenotypic protein markers normalized to the maximum mean value across subsets.
E, F, As in C, except CyTOF analysis is for indicated CD8+ TCM (h) or TEM (i) subsets.
G, Pearson correlation between CD8+ TCM vs. TEM subset frequencies in BGB-283+tram treated mice on (pooled data from days 4 and 11).
