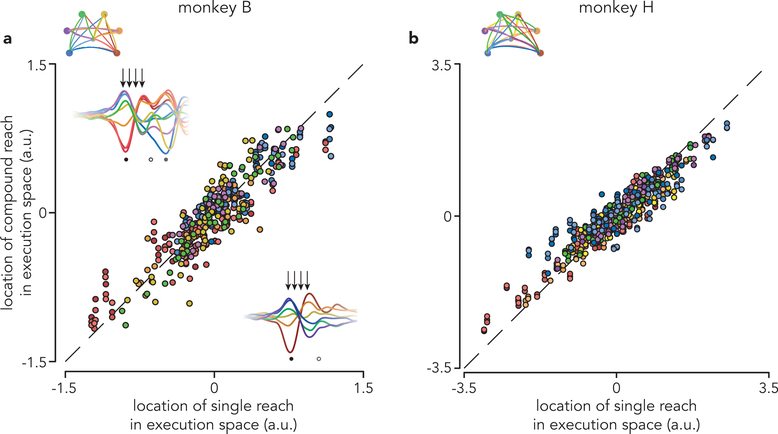
Extended Data Fig. 6. Patterns of execution-related activity.
Analysis is similar to that in Fig. 5, but was applied to activity during movement. a, Comparison between single and compound reaches. Each marker plots the activity (in 1 of 10 execution dimensions, at a single point in time) for a pair of conditions that share a first reach. Because execution activity (unlike preparatory activity) is strongly time-varying, we include activity from 4 time points (50 ms intervals, starting 25 ms before reach onset). Data are from monkey B. b, same but for monkey H.

