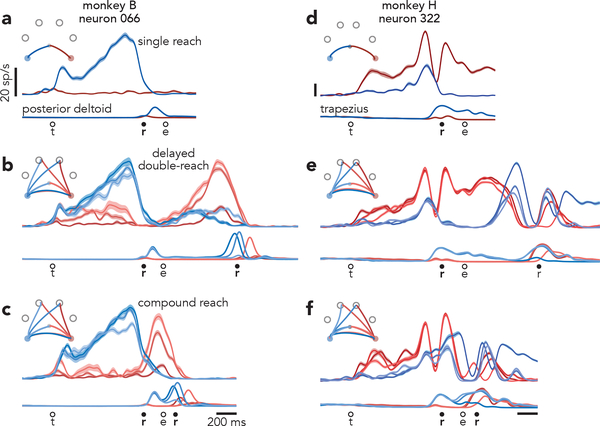
Fig. 3 |. Single-neuron responses.
a, Activity of one neuron, recorded from monkey B during single reaches to bottom-right (red) and bottom-left (blue) targets. Envelopes around individual traces correspond to the standard error of the mean (n > 28 trials for all traces from this neuron). Thin traces at bottom plot the activity of the posterior deltoid. Circles indicate the time of target onset (t), reach onset (r), and reach end (e). All traces are trial-averages of data that have been aligned twice: once to target onset and once to reach onset. See Methods for a complete description of data pre-processing. b, Response of the same neuron and muscle during delayed double-reach conditions. Monkey B performed six such conditions, all of which are shown. For monkey B, delayed double-reaches used fewer combinations than compound reaches, to allow multiple inter-reach pause durations while maintaining reasonable trial-counts. c, Response of the same neuron and muscle during compound reaches. Trace color corresponds to the direction of the first reach. Monkey B performed ten compound reach conditions, but for illustration only those with corresponding delayed double-reach conditions are shown. Data for all conditions is plotted in Extended Data Fig. 2. d, Activity of one neuron, recorded from monkey H during single reaches. Same format as a (n > 19 trials for all traces from this neuron) Thin traces at bottom plot the activity of the trapezius. e, Activity of the same neuron and muscle during delayed double-reaches (same format as b). f, Activity of the same neuron and muscle during compound reaches. Responses during all tested conditions are plotted in Extended Data Fig. 3a.

