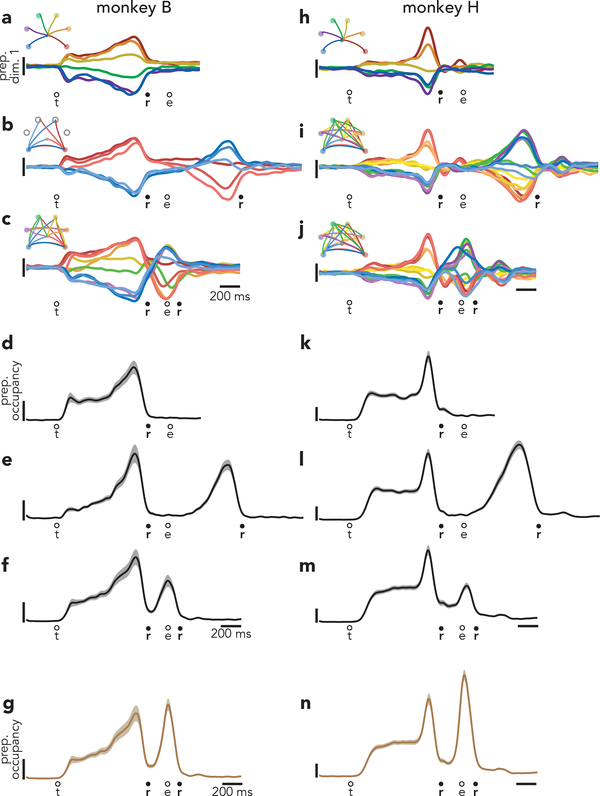
Fig. 4 |. Time-course of activity in preparatory dimensions.
a, Projection of population activity, during single reaches, onto the first preparatory dimension. Data are from monkey B. Unlike in Fig. 3, data are shown for all conditions. Vertical scaling is arbitrary and conserved across panels. Circles indicate the time of target onset (t), reach onset (r), and reach end (e). b, The same projection for delayed double-reaches. c, The same projection for compound reaches. Note that monkey B performed four fewer 600 ms delay double-reach conditions than compound reach conditions. d, Preparatory subspace occupancy (for all 20 dimensions) during single-reach conditions. Shaded regions indicate the standard deviation of the sampling error (equivalent to the standard error of the mean) estimated by resampling individual units (n = 1000 resampled populations). Because occupancy is a measure of normalized firing rates, the units are arbitrary. e, Preparatory subspace occupancy during delayed double-reaches. f, Preparatory subspace occupancy during compound reaches. g, Same as f, but preparatory dimensions were found using an expanded range of times that included activity during the brief dwell-period between compound reaches. h-j, Same as a-c but for monkey H. Note that monkey H performed more two-reach conditions than monkey B. k-n, Same as d-g but for monkey H. Occupancy just prior to the second reach in compound reach conditions (f,m) was significantly greater than the occupancy during the same time period of single reaches for both monkeys (p < 0.001 for both monkeys via a bootstrap procedure; see Methods).

