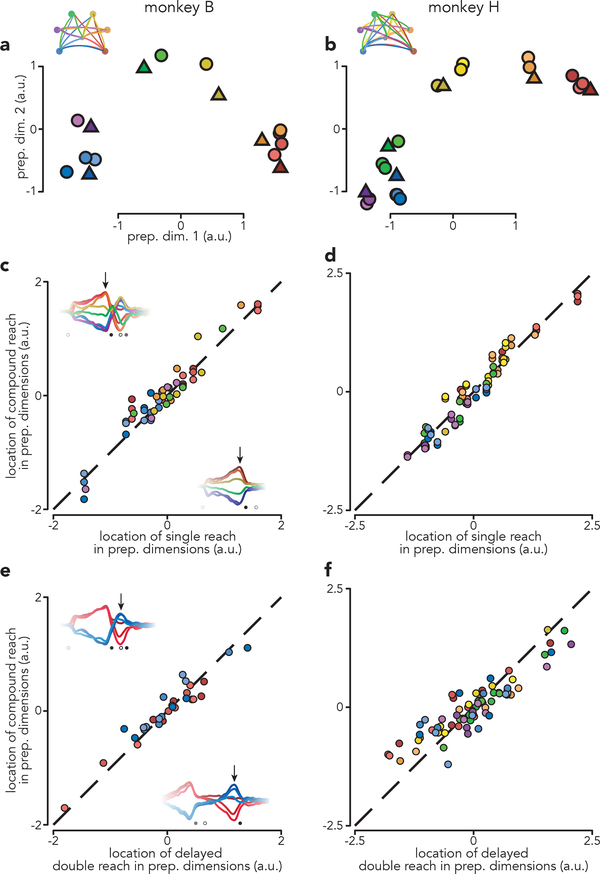
Fig. 5 |. Patterns of preparatory activity.
a, Projections of population activity, just before first-reach onset, onto the top two preparatory dimensions. Triangles represent single reach conditions. Circles represent compound reach conditions. Marker colors indicate first-reach direction. Data are from monkey B. b, Same as a but for monkey H. Monkey H performed more compound reach conditions than monkey B. c, Comparison of preparatory activity, before first-reach onset, between compound and single reaches. Each circle plots the location of activity before one compound reach versus that for the corresponding single reach. Each such comparison yields five datapoints, one for each of the top five preparatory dimensions. Dashed line indicates unity slope. Data are for monkey B. Arrows on each inset indicate when preparatory subspace activity was assessed, 120 ms before reach onset. Results were virtually identical when we used times earlier in the delay: the correlation was ρ = 0.96 regardless of whether preparatory activity was assessed 120 ms, 220 ms, or 320 ms prior to reach onset (p<0.0001 in each case).d, same as c but for Monkey H. Again, results were insensitive to the exact time when preparatory activity was assessed: ρ = 0.96, 0.97 and 0.95 for the three times (p<0.0001 in each case). e, Comparison of preparatory activity, prior to the second reach, between compound reaches and matched delayed double-reaches. Arrows on each inset indicate when preparatory subspace activity was assessed. f, same as e but for monkey H.

