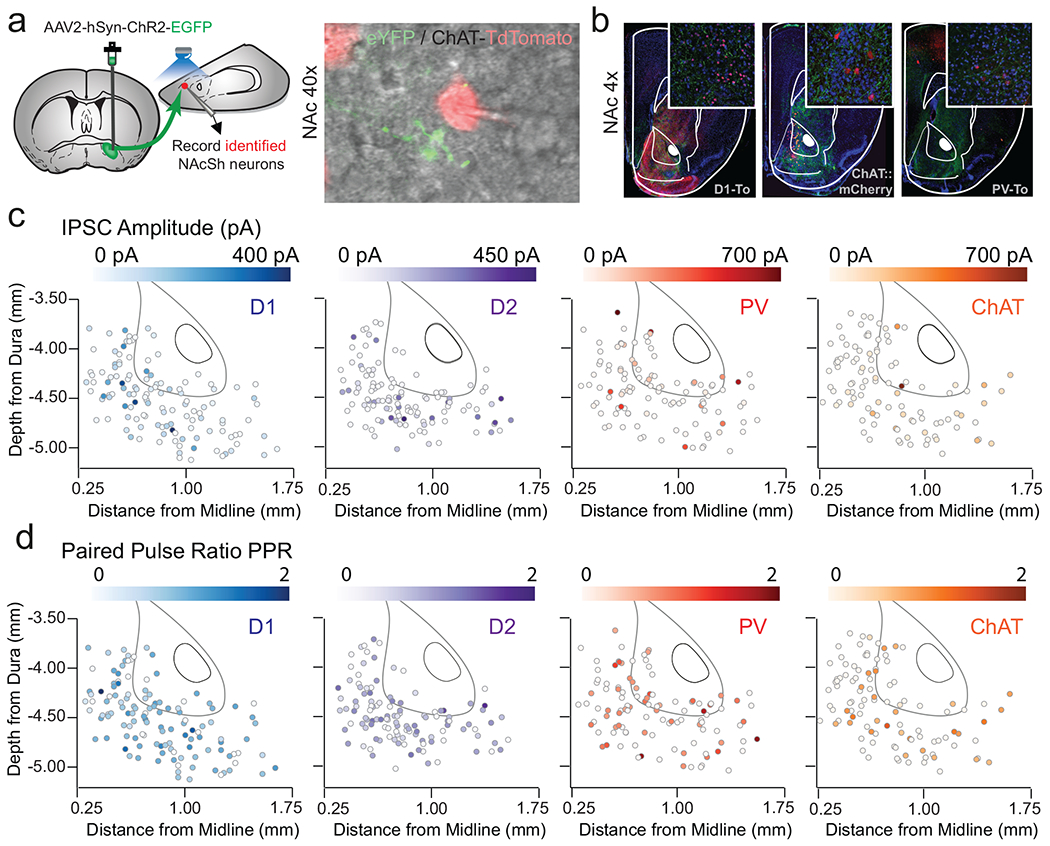
Extended Data Fig. 4. Topography of release properties of VP inputs to NAcSh.

(a) Merged fluorescent image of recorded tomato-expressing neuron adjacent to EYFP-labeled terminals from the VP during patch-clamp experiments. (b) 4x image of ChR2-injection site in VP and terminal fields in the NAc in each of three reporter lines. Amplitude (c) and PPR (d) of oIPSC expressed as location of recorded neuron within the NAcSh in D1-MSNs (n=118 cells / 11 mice), D2-MSNs (n=117 cells / 12 mice), PVs (n=112 cells / 12 mice), and CINs (n=104 cells / 10 mice), scale bar = 50 μM.
