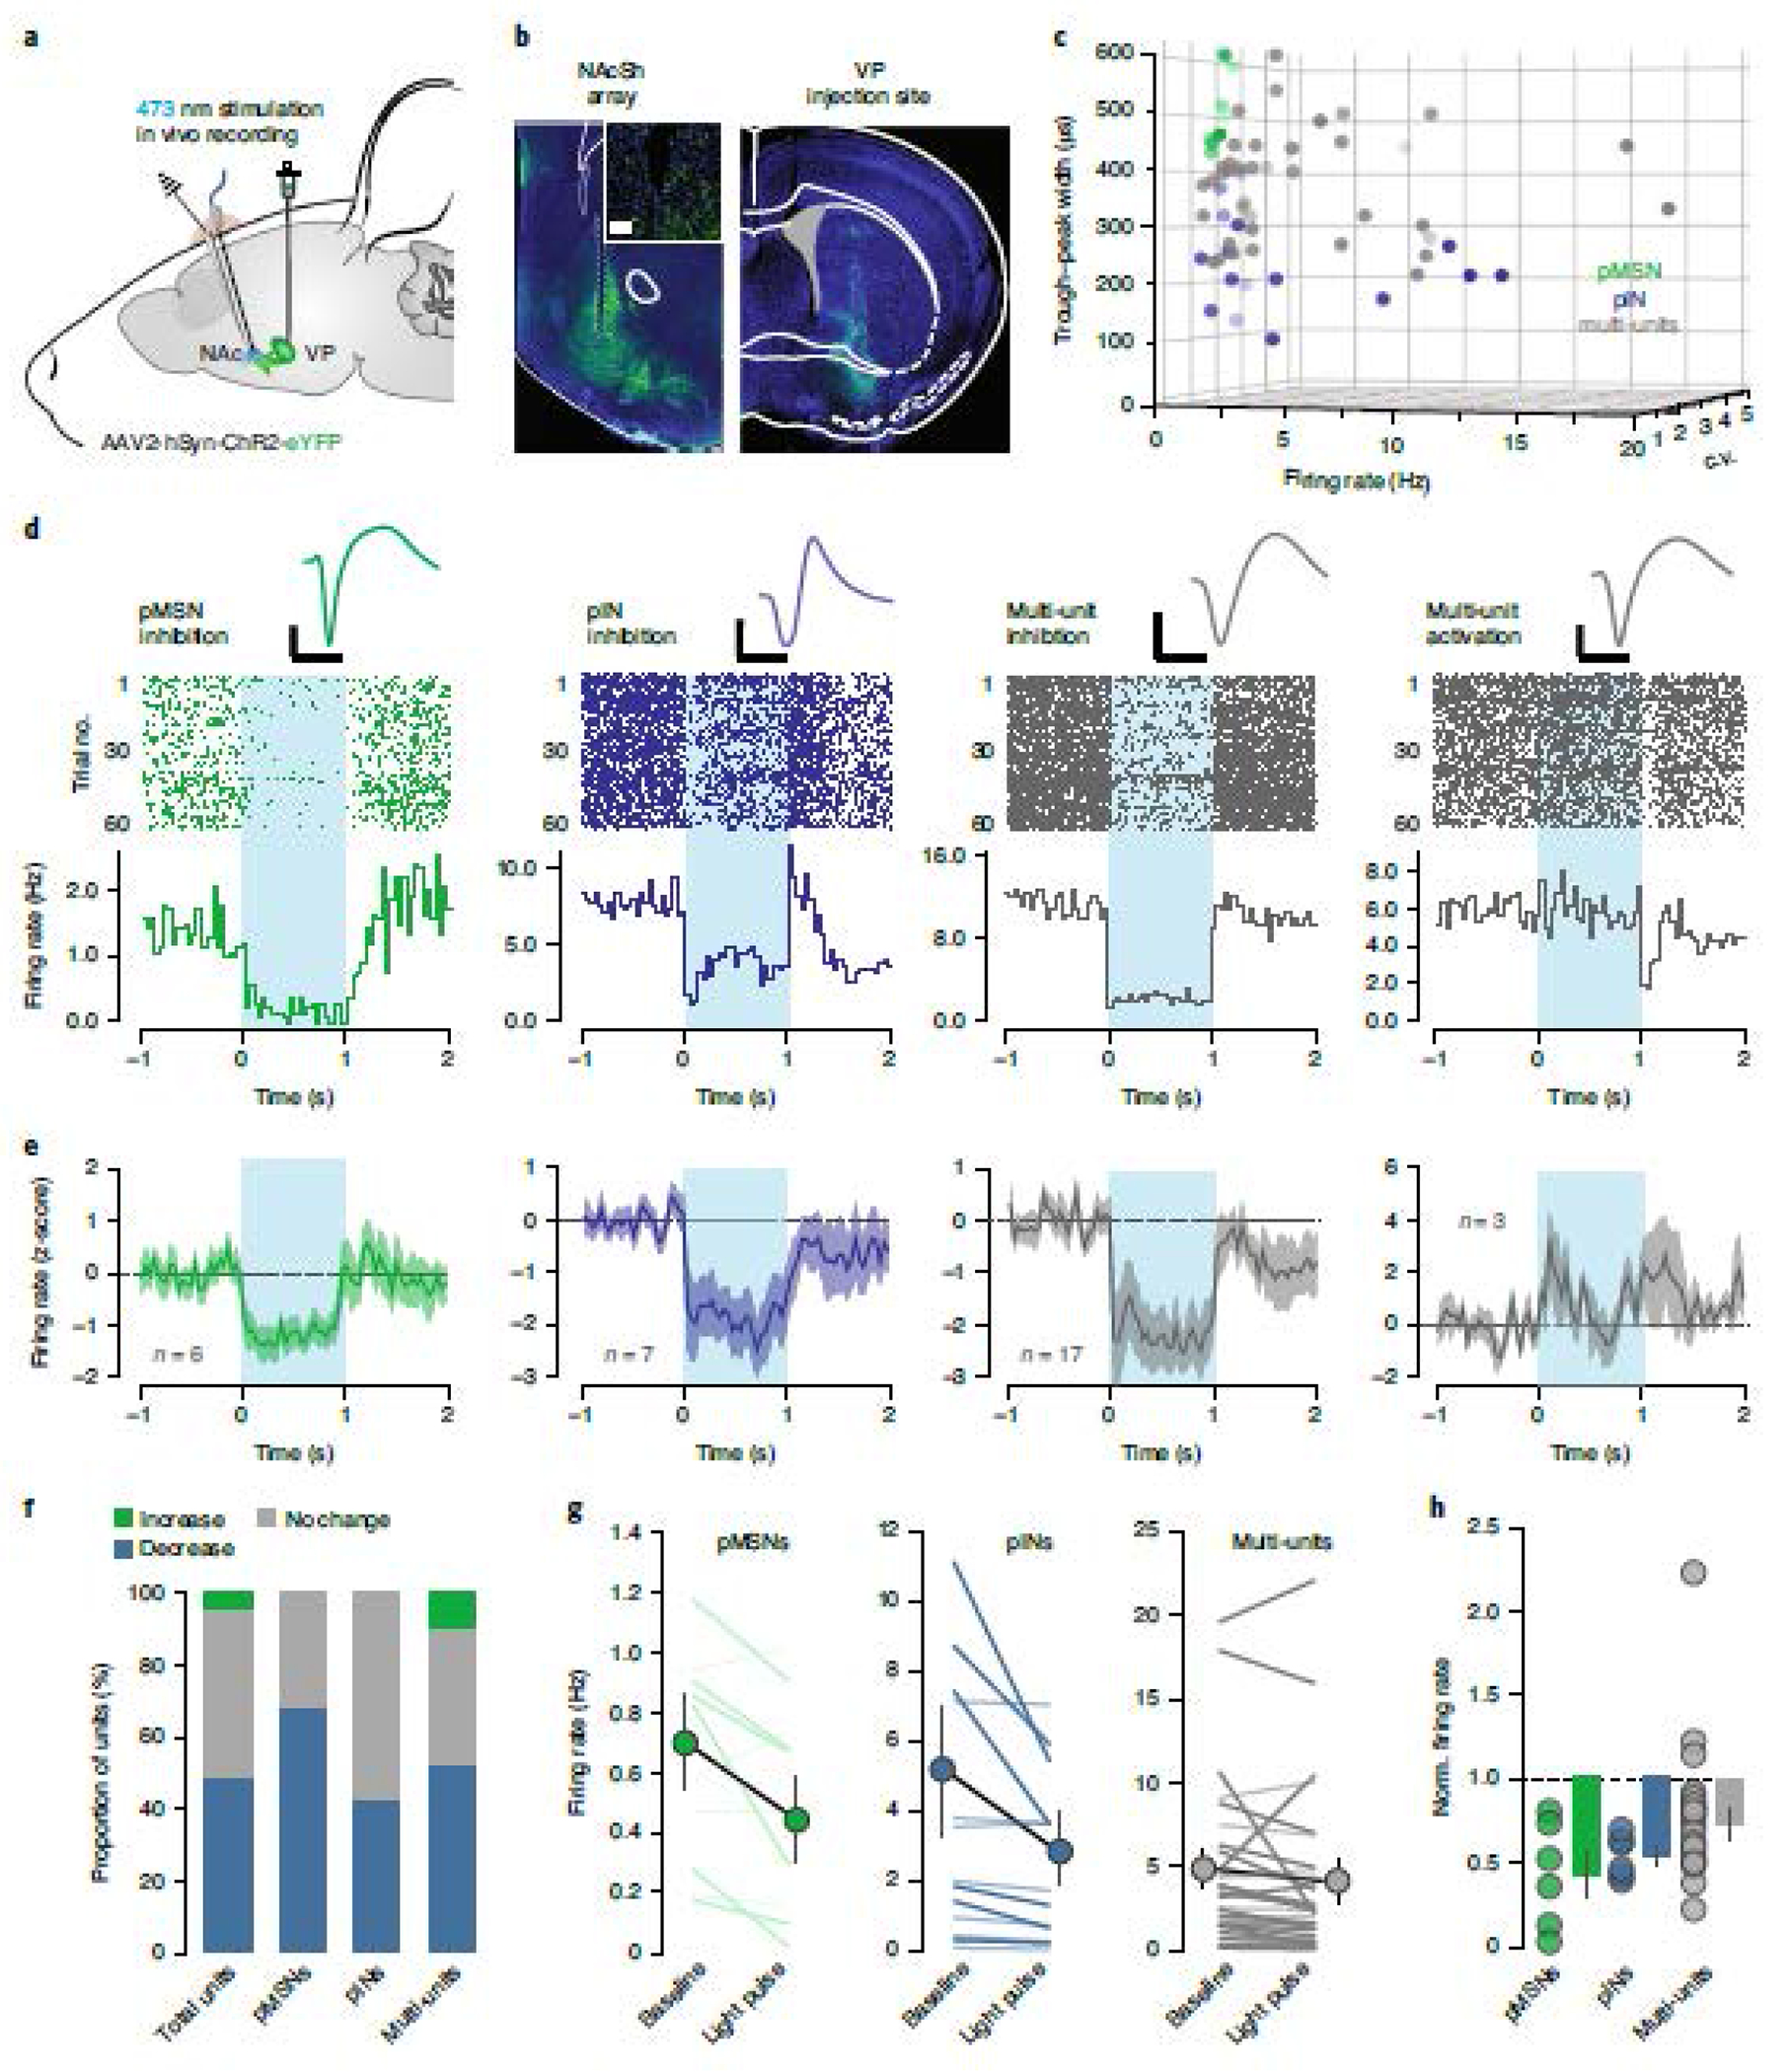
Figure 4. Activation of vArky terminals inhibits NAcSh firing in vivo.

(a) ChR2 was injected in the VP, a recording array with optic fiber was implanted in the NAcSh. (b) 4x images of NAc and VP; inset: 20x confocal image of array site. Scale bar = 50 μM. (c) Units were classified into clusters by peak-to-valley width, firing rate and CV (n = 9 pMSNs, 14 pINS, 32 multi-units from 6 mice, see Extended data figure 5). (d-e) Representative waveform, raster plot and PSTH of single neuron examples (d) and mean ± sem (e) of light-modulated units over 60 trials; 1 sec light pulse is indicated. Scale bar = 500μs, 50μV. (f) Proportion of light-modulated units by neural subtype. (g) Firing rate immediately preceding and after light pulse are shown for each cell-type; dark lines: light-modulated units, light lines: non-significantly modulated units (pMSN pre: 0.97 ± 0.11 post: 0.62 ± 0.18, p = 0.015, pINs pre: 4.52 ± 1.68, post: 2.51 ± 0.91, p=0.007, decreased multi-units pre: 4.21 ± 1.12 post: 2.75 ± 0.94, p=0.013, increased multi-units pre: 9.12 ± 5.24 post: 12.13 ± 5.36, p = 0.002). (h) Normalized firing rate of all light-modulated units, relative to baseline is shown (pMSNs = 0.46 ± 0.13, multiunits = 0.66 ± 0.05, pINs = 0.59 ± 0.05, F2 = 1.789, p =0.185).
