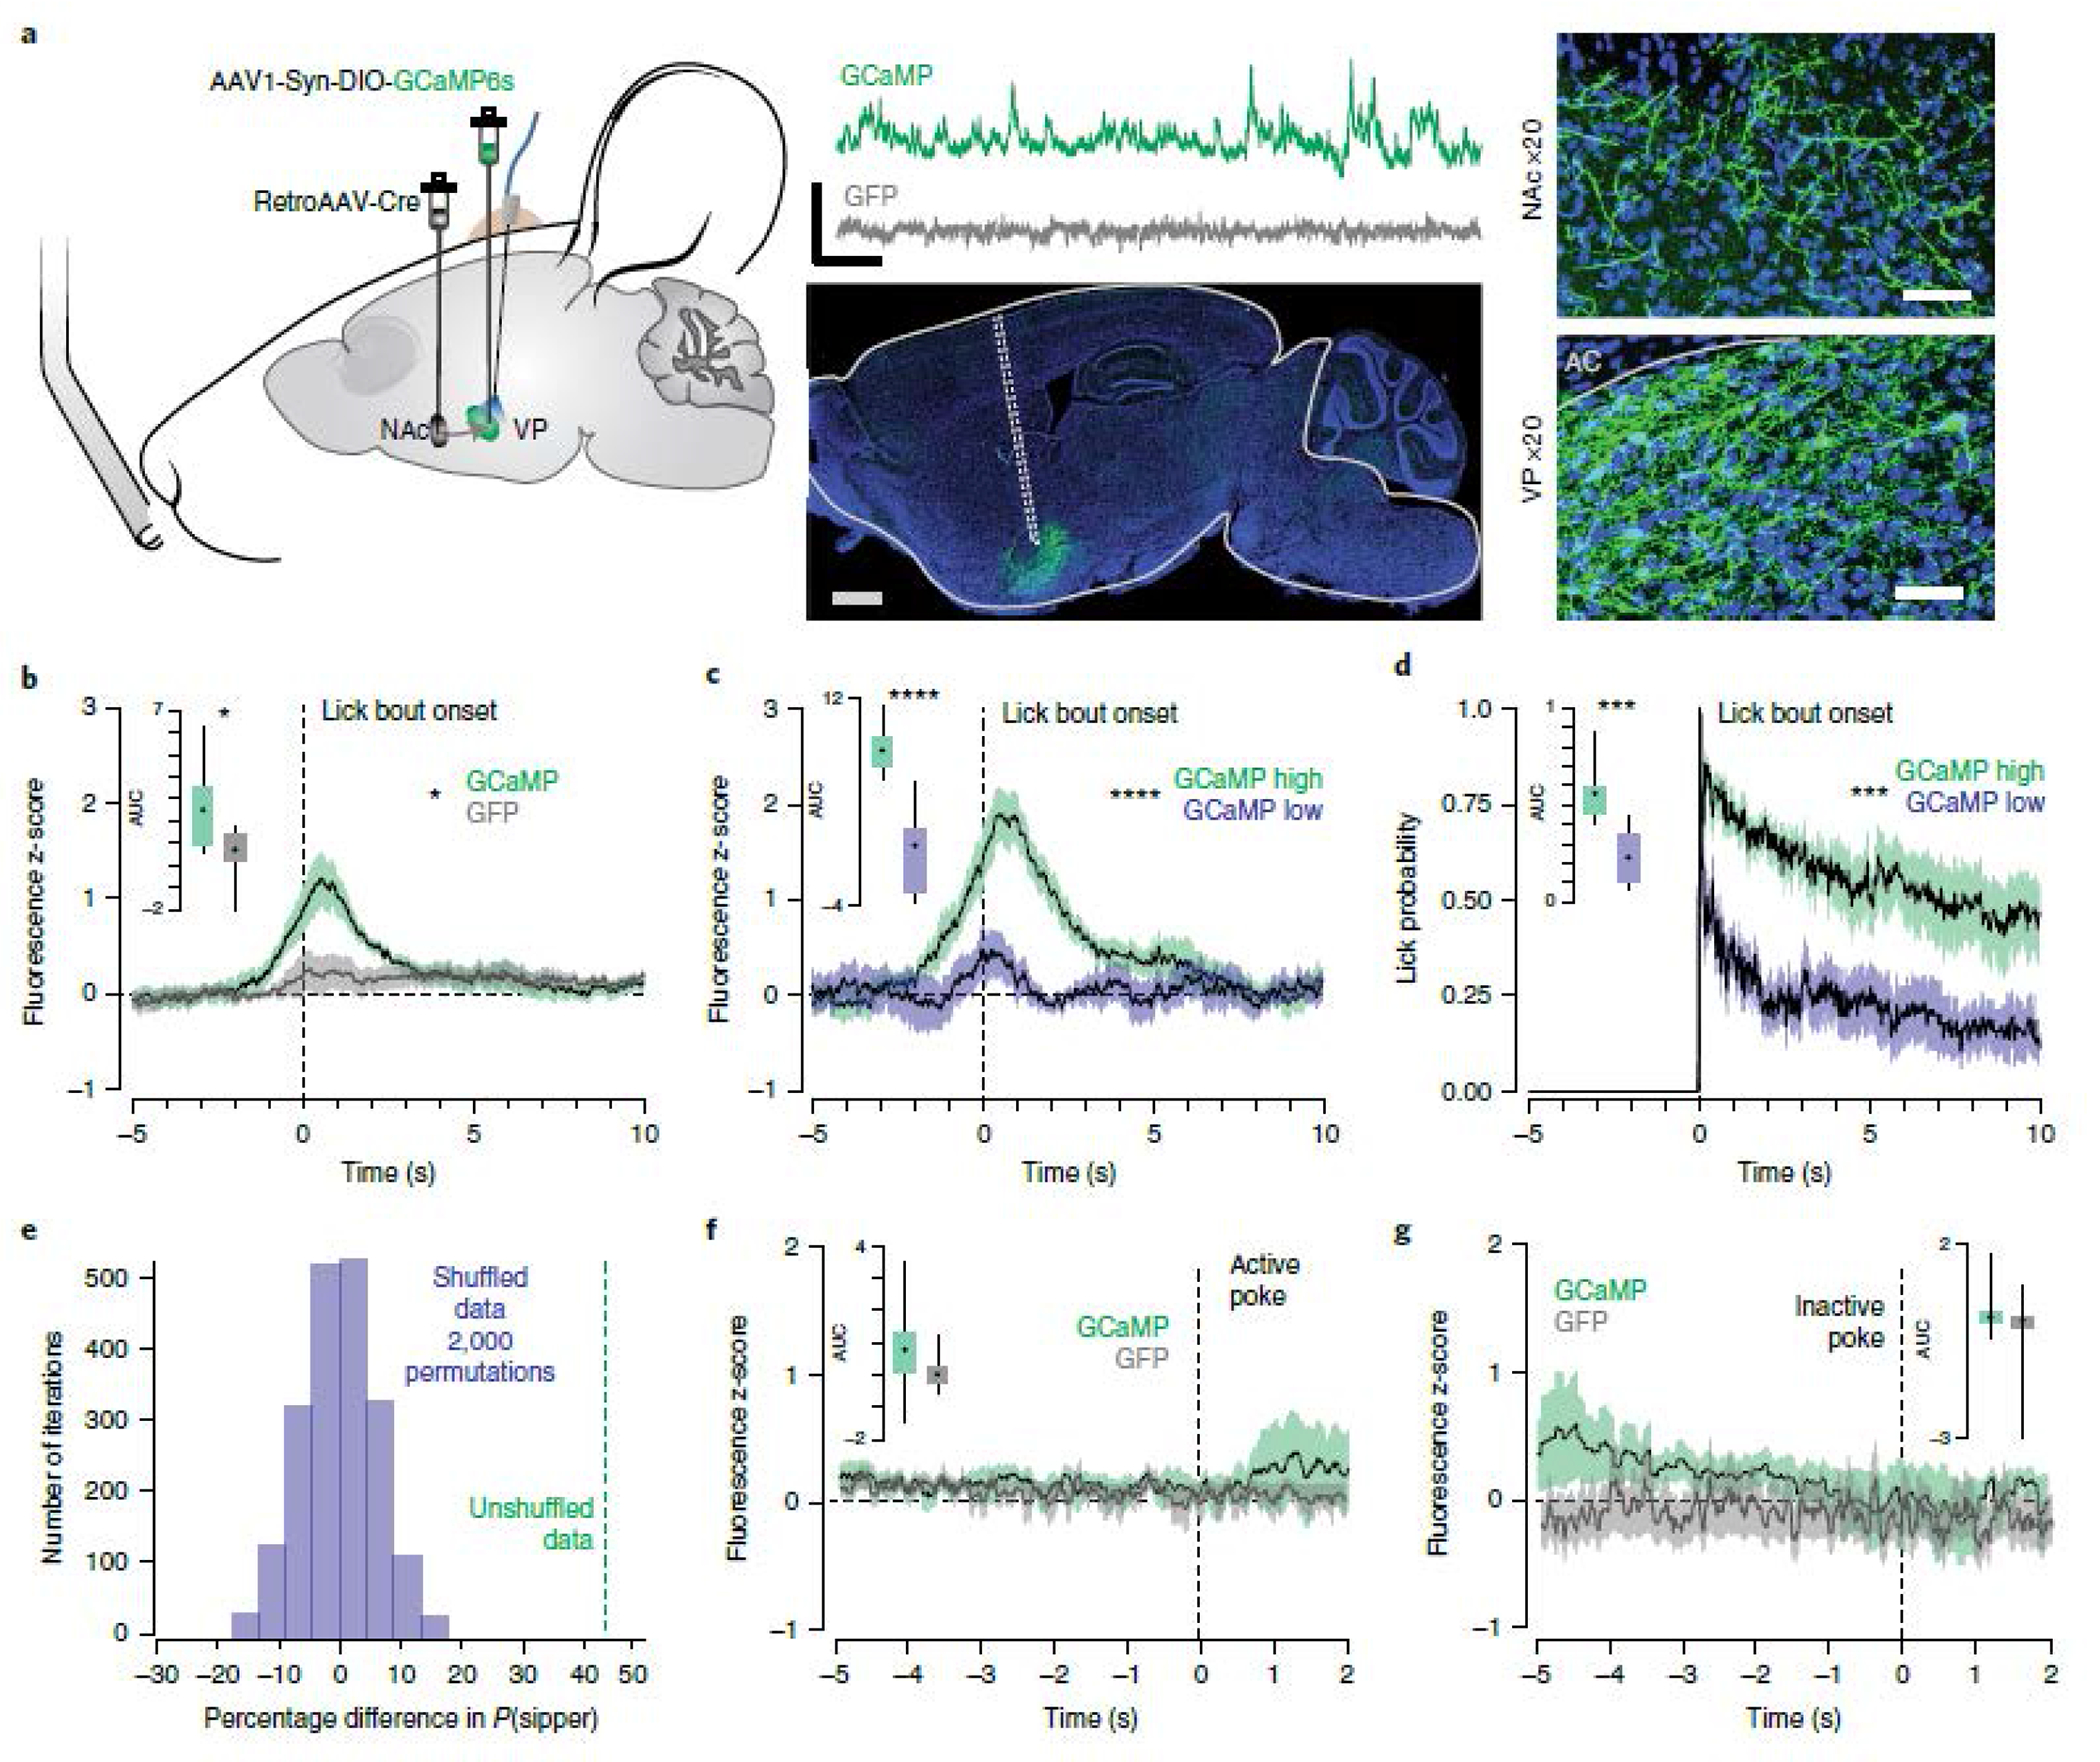
Figure 5. vArky calcium activity is correlated with duration of reward consumption.

(a) retroAAV-Cre was injected into the mNAcSh, AAV-DIO-GCaMP6s was injected in the VP, an optic fiber was implanted in the VP (n=9 GFP / 9 GCaMP, scale bar = 1 mm). Representative traces of Ca2+ signal acquired from optic fiber implanted in VP (scale bar=20s, 1 z-score) and 20x confocal images of cell bodies in the VP and terminal fields in the NAc (scale bar=50 μM). (b) Combined fluorescence responses from all mice, aligned to onset of lick bout (AUC GCaMP: 2.43±0.75, AUC GFP: 0.52±0.71, F=7.213, p=0.016). (c) Fluorescence responses in GCaMP mice, split into upper and lower quartiles based on AUC (44 trials/condition, AUC high trials: 5.76±0.575, AUC low trials: 2.37±0.4911, RM ANOVA, F=13.86, p < 0.0001). (d) Licking behavior aligned to bout onset for high- and low-GCaMP signal trials (AUChigh signal trials: 5.76±0.57, AUClow signal trials: 2.37±0.49, FHigh•Low=20.08, p<0.001). (e) Permutation analysis: distribution of mean difference in lick bout probability between high-and low-VP signal trials with 2000 permutations of shuffled trials (Pshuffled (LickBout)VP-Hightrials – Pshuffled(LickBout)VP-Low trials = 0.6%), mean difference in real data shown in green (Preal(LickBout)VP-High trials – Preal(LickBout)VP-Low trials = 42.6%). (f-g) GGaMP and GFP signal aligned to active (mean AUC GCaMP: 0.78±0.66, GFP: 0.30±0.46) and inactive nose pokes (mean AUC GCaMP:1.09±0.54, GFP: −0.65±1.56) in an operant task (Fvirus = 0.58, p=0.46, Factive v inactive=1.83, p=0.20). Data represented as mean ± sem. ***p<0.0001.
