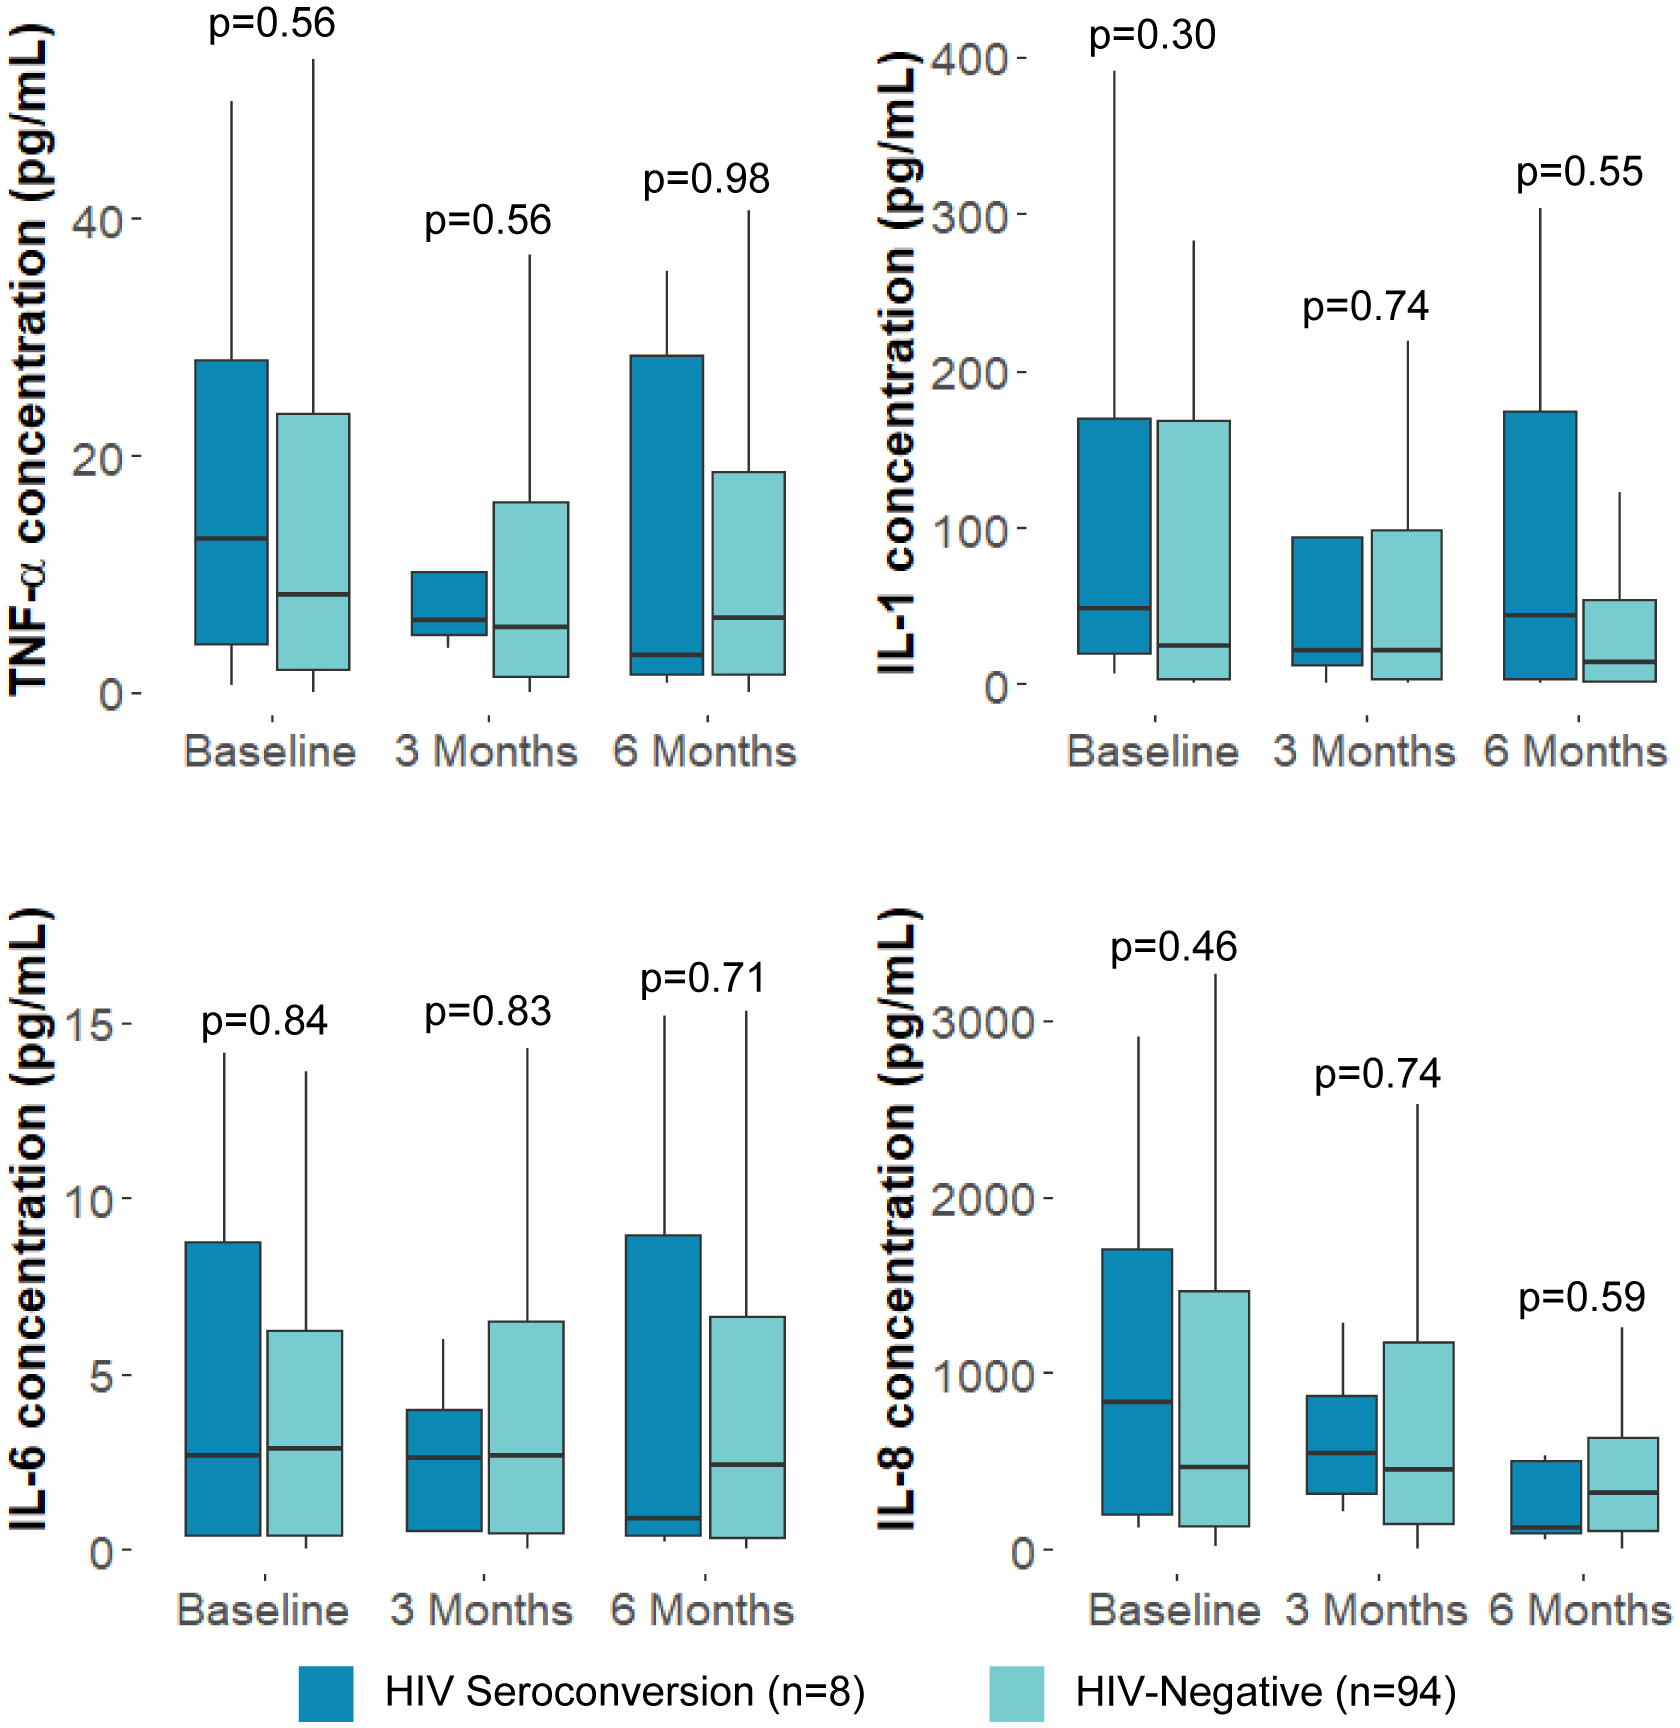
Figure 1: Median rectal mucosal cytokine levels of men who have sex with men who experienced HIV-1 seroconversion compared to men who have sex with men and transgender women who remained HIV-negative; Lima, Peru 2018–19.

IL = Interleukin; TNF = Tumor Necrosis Factor
Box plots display the 25th percentile, median, and 75th percentile of values. Lower whiskers represent the minimum value of data within 1.5 times of the interquartile range (IQR) below the 25th percentile. Upper whiskers represent the maximum value of data within 1.5 times the IQR above the 75th percentile. P-values calculated using Wilcoxon Rank-Sum tests.
