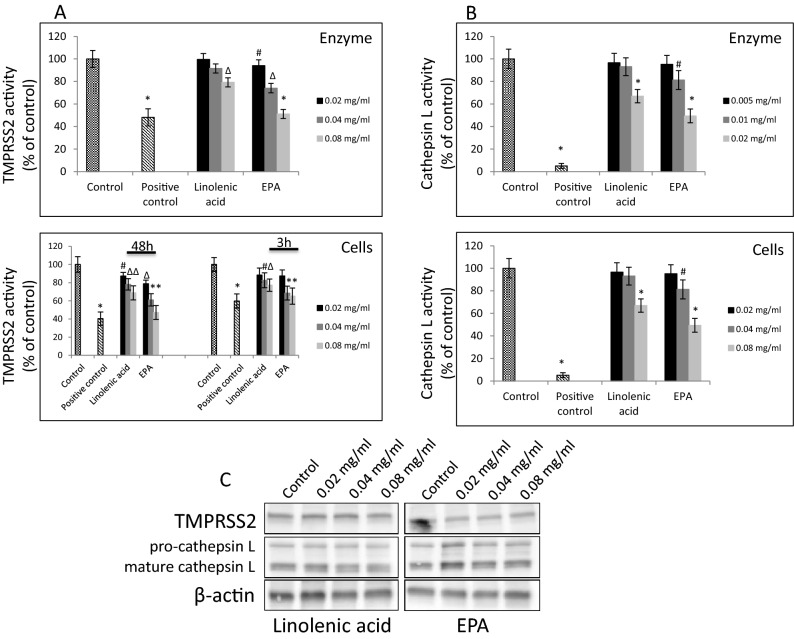
Figure 6.
Effect of selected FAs on TMPRSS2 and Cathepsin L proteases. (A) Purified TMPRSS2 enzyme at 1 µM was incubated with selected FAs at different concentrations for 1 h at RT followed by addition of fluorogenic substrate at 10 µM concentration for 30 min. Fluorescence signal was measured at Ex/Em = 360/440 nm using spectrofluorimeter (upper panel). A549 cells were treated with indicated FAs at different concentrations for 3 h and 48 h at 37 °C and enzymatic activity was measured by addition of 0.2 mM fluorogenic substrate and incubation for 30 min. at 37 °C. Fluorescence signal was measured at Ex/Em = 360/440 nm using spectrofluorimeter (lower panel). Data are presented as % of control ± SD; #p ≤ 0.05, ∆p ≤ 0.01, *p ≤ 0.001. Control—0.025% DMSO, positive control—50–100 μM camostat mesylate. (B) Purified cathepsin L enzyme at 0.02 ng/µl was incubated with selected FAs at different concentrations for 1 h at RT followed by addition of fluorogenic substrate at 10 µM concentration for 30 min. Fluorescence signal was measured at Ex/Em = 360/440 nm using spectrofluorimeter (upper panel). A549 cells were treated with indicated lipids at different concentrations for 24 h at 37 °C and enzymatic activity was measured by addition of 0.2 mM fluorogenic substrate and incubation for 30 min. at 37 °C. Fluorescence signal was measured at Ex/Em = 360/535 nm using spectrofluorimeter (lower panel). Data are presented as % of control ± SD; #p ≤ 0.05, *p ≤ 0.001. Control—0.025% DMSO, positive control—0.1 μM E-64. (C) Western blot analysis of TMPRSS2 and cathepsin L expression in A549 cells treated with indicated FAs with different concentration for 48 h. Detection was done using rabbit anti-TMPRSS2 monoclonal antibody at 1:1000 and mouse anti-cathepsin L antibody at 1:200. Experiments were done in triplicate and repeated three times. Data are presented as % of lipid-free control ± SD.

