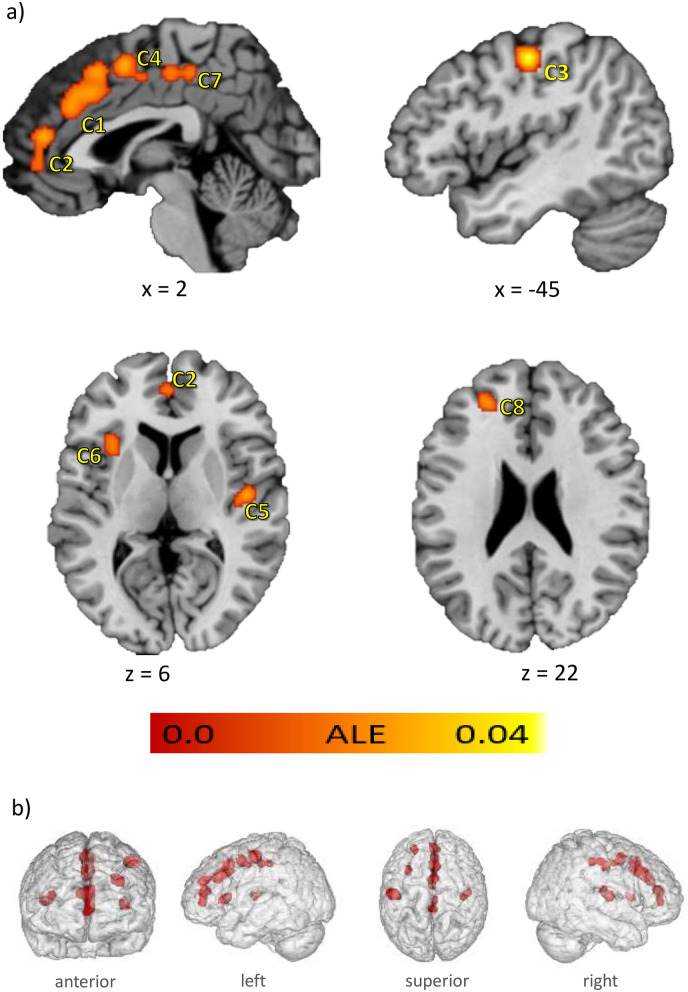
Figure 3.
Results of the ALE meta-analysis. The highlighted clusters (C1–C8) represent significant convergence about grey matter differences in AUD patients compared to healthy controls. (a) Clusters are depicted on brain slices of an MNI standard brain. Color indicates ALE value. (b) Spatial position and expansion of the ALE-clusters depicted on a grey matter glass brain. Cluster-forming threshold p < 0.001, family wise error (FWE) cluster level corrected at p < 0.05. x, y and z values refer to coordinates in MNI space, for detailed MNI peak voxel coordinates of the ALE clusters see Table 2. This image was created with Mango v4.1. (http://ric.uthscsa.edu/mango/).

