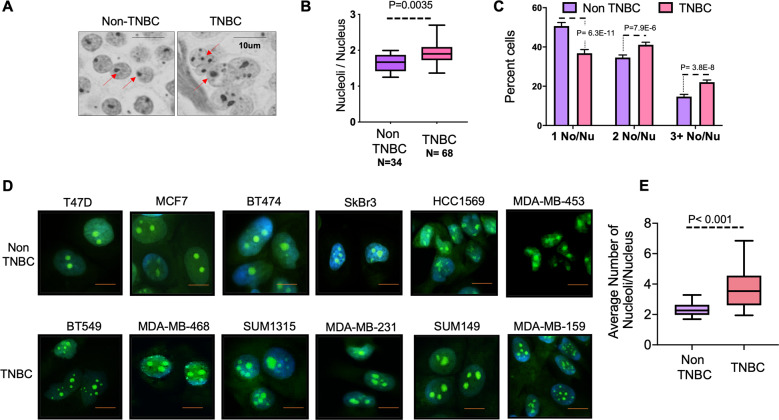
Fig. 1. TNBC cells have more nucleoli than non-TNBC cells.
A Representative image of AgNOR stained human breast cancer tissue sections classified as TNBC or non-TNBC. Red arrows point at nucleoli. B Quantification of nucleolar number (using AgNOR staining) in human breast cancer tumor tissue sections classified as TNBC or Non-TNBC. Number of nucleoli per nucleus from cells in each specimen were counted. The data is represented as a box and whiskers plot. C Cells from each human breast cancer tumor tissue section, classified as TNBC or non-TNBC were separated into groups of cells with one nucleolus/nucleus, two nucleoli/nucleus, and three or more nucleoli/nucleus. These groups were represented as percent cells in each group. D Representative images of NucleolarIDTM stained cells from TNBC or Non-TNBC cell lines. Focused bright green staining demarcates nucleoli. DAPI staining (blue) marks the nucleus. E Quantification of nucleolar number (using NucleolarIDTM staining) in human breast cancer cell lines. The number of nucleoli per nucleus from six TNBC and six non-TNBC cell lines was counted. The data is represented as a box and whiskers plot and was significantly decreased in the non-TNBC cell lines (P < 0.001). Significance was determined using a T-test and all error bars indicate SEM.

