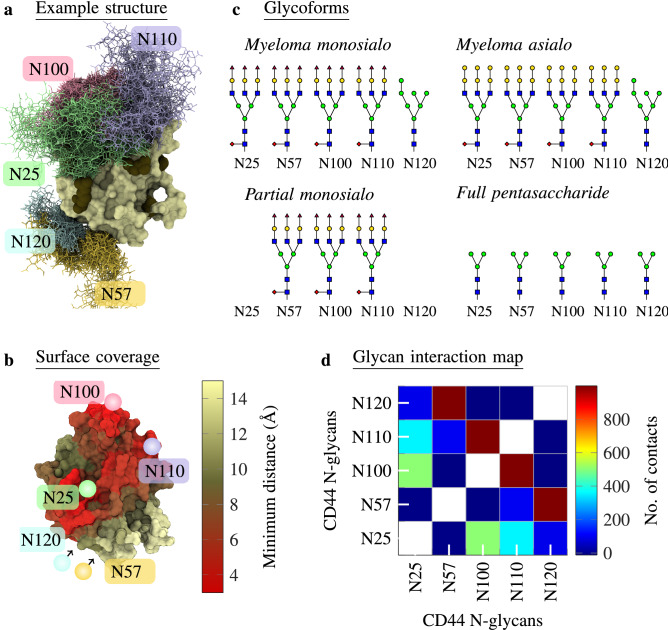
Figure 2.
(a) Example structure of CD44-HABD with the myeloma monosialo glycoform (system G2 in Table 2). CD44-HABD is colored pale, and different colors separate the glycans. Glycans are depicted at every 50 ns in a trajectory of 1000 ns. (b) CD44-HABD with the surface colored according to the minimum distance to the N-glycans (not shown). Pale color corresponds to CD44–N-glycan distances over 15 Å, whereas bright red corresponds to distances less than 3 Å. The distance data have been averaged over 15 replicas (myeloma monosialo glycoform). (c) Glycoforms used in this study. The symbols follow the Symbol Nomenclature for Graphical Representations of Glycans36. (d) Number of contacts (defined as distance < 0.6 nm) between the five N-glycans on CD44-HABD (myeloma monosialo glycoform). The results have been averaged over time and 15 replicas. Another simulation force field (CHARMM36) in Notes SC and SD shows consistent data.

