Figure 3.
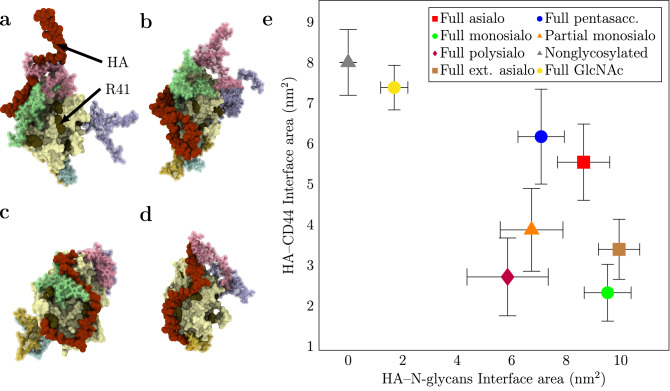
(a–d) Example structures ( ns) of HA–CD44 complexes obtained in the spontaneous binding simulations (B3–6 in Table 2). The snapshots shown here are randomly selected from multiple simulation replicas. The color coding for HABD and N-glycans is the same as in Fig. 2. For comparison, examples of nonglycosylated CD44–HA complexes can be found from Ref. 14. (a) full monosialo glycoform (B4), (c) full asialo glycoform (B3), (b) full polysialo glycoform (B6), and (d) partial monosialo glycoform (B5). (e) Plot of HA–CD44 interface area vs HA–N-glycans interface area in different glycoforms. The data are calculated with GROMACS tool gmx sasa from systems B1–8. Error bars represent standard errors.

