Figure 5.
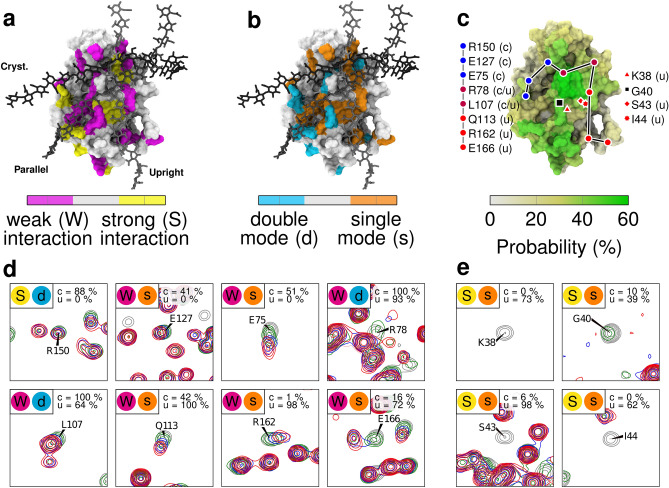
NMR titration of CD44-HABD by hyaluronate hexamer. Structures shown in a, b, and c are extracted from our previous study, where the CD44 coordinates are based on PDB:1UUH. (a) Selected N/H HSQC signals are sorted in two groups—residues with an immediate shift/disappearance of the signal, i.e., strong interaction (yellow color), and residues with a gradual shift, i.e., weak interaction (magenta color). (b) The signals are sorted in two groups — residues with a single signal, i.e., single binding mode (orange color), and residues with a doubled signal, i.e., double binding mode (cyan color). Hyaluronate hexadecamers are shown in three possible binding modes distinguished by shades of gray– the crystallographic (cryst.), parallel (parallel), and upright (upright) mode. (c) Hyaluronate-perturbed residues in simulations. The colored surface displays the probability of a given residue to be in contact with HA6 in our simulations (G5 in Table 2). Filled circles highlight the positions of selected residues from both the crystallographic and upright modes, which were perturbed by hyaluronate binding in our NMR experiments (cf. d). These marks are also colored based on the predominant binding mode of the highlighted residues in our earlier simulations14. Lines between the residues are drawn to guide the reader. The position of residues belonging to the R41-containing binding epitope is also shown (cf.e). Fig. S5 in Note SF shows similar surface data for both hexamer systems (Systems G5 and G6 in Table 2) (d). (e) Selected N/H HSQC signals are shown for free N-CD44-HABD (grey), N-CD44-HABD with equimolar hyaluronate hexamer (green) and twofold (blue) and a threefold (red) molar excess of hyaluronate hexamer. Colored circles (top left) indicate to which category the residue falls in (a,b). Probability of a given residue to interact with HA in each binding mode in our earlier simulations14 is indicated in the top right corner of each graph.

