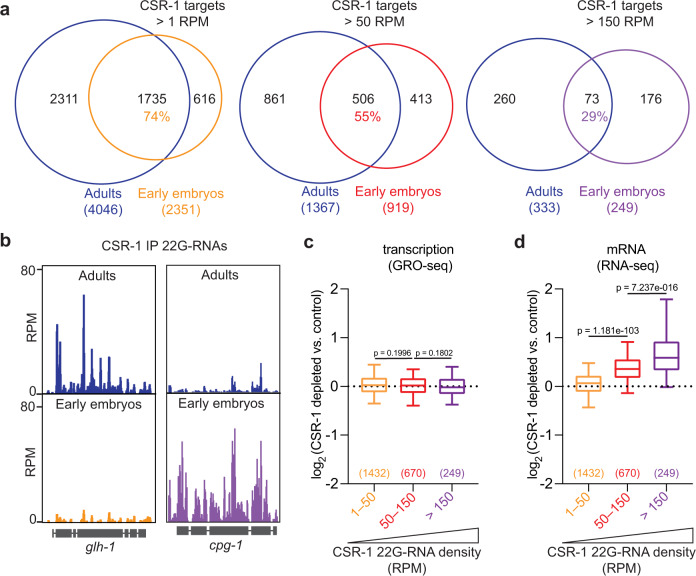
Fig. 2. CSR-1 post-transcriptionally regulates its targets in the embryo.
a Venn diagram showing the overlap between CSR-1 targets in adults and in early embryos. A gene is considered a CSR-1 target when the ratio between normalized 22G-RNAs from CSR-1 immunoprecipitation and the total RNA in the input is at least 2. We have selected three categories of CSR-1 targets based on the density (reads per million, RPM) of 22G-RNAs from CSR-1 immunoprecipitation: CSR-1 targets >1 RPM, CSR-1 targets >50 RPM, CSR-1 targets >150 RPM. The number of genes and the percentage of overlapping is indicated. b Genomic view of two CSR-1 target genes showing normalized 22G-RNAs in CSR-1 IPs from adult (top) or early embryos (bottom). c, d Box plots showing the log2 fold change of nascent RNAs (by GRO-seq) or mRNAs (by RNA-seq) in CSR-1-depleted early embryos compared to control for gene sets of increasing 22G RNA density, 1–50 RPM, 50–150 RPM, >150 RPM. The line indicates the median value, the box indicates the first and third quartiles, and the whiskers indicate the 5th and 95th percentiles, excluding outliers. Two-tailed P values were calculated using Mann–Whitney–Wilcoxon tests. The sample size n (genes) is indicated in parentheses. Source data are available online.

