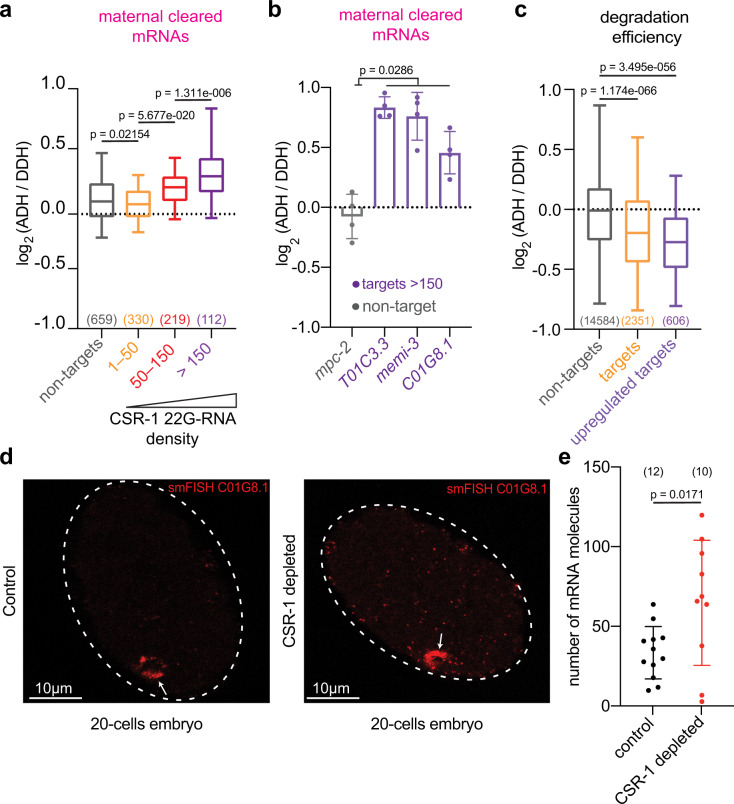
Fig. 4. CSR-1 cleaves maternal mRNAs in early embryos.
a Box plots showing the log2 fold change of cleared maternal mRNAs in CSR-1-depleted early embryos rescued with transgenic expression of CSR-1 ADH (catalytic dead) or CSR-1 DDH (catalytic active) for gene sets of increasing 22G RNA density, 1–50 RPM, 50–150 RPM, >150 RPM or non-target genes. The line indicates the median value, the box indicates the first and third quartiles, and the whiskers indicate the 5th and 95th percentiles, excluding outliers. The sample size n (genes) is indicated in parentheses. b RT-qPCR showing log2 fold change of maternal cleared mRNAs in CSR-1-depleted embryos with transgenic expression of CSR-1 with (ADH) or without (DDH) mutation in the catalytic domain. Data are presented as mean ± SD from four biologically independent replicates. c Box plots showing the log2 fold change of the degradation efficiency in CSR-1-depleted early embryos rescued with transgenic expression of CSR-1 ADH versus CSR-1 DDH. The degradation efficiency was calculated by the ratio of normalized degradome-seq reads versus RNA-seq reads. The line indicates the median value, the box indicates the first and third quartiles, and the whiskers indicate the 5th and 95th percentiles, excluding outliers. The sample size n (genes) is indicated in parentheses. Genes with 0 counts in RNA-seq (ADH/DDH) have been excluded from calculation. “Upregulated targets” = CSR-1 targets with log2FC (ADH/DDH) > 0 and adjusted P value <0.05 by RNA-seq. d Representative images of C01G8.1 mRNA smFISH in control (left) and CSR-1 depleted (right) 20-cell stage embryos. Arrows indicates the accumulation of mRNAs in germline blastomere. e smFISH quantification of C01G8.1 mRNA (embryonic CSR-1 target) in somatic blastomeres of control (black) and CSR-1 depleted (red) 20-cell stage embryos. Data are presented as mean ± SD and the dots are the number of mRNA molecules per embryo section. The sample size n (embryos) is indicated in parentheses. Scale bars represent 10 µm. In a, b, c, e, two-tailed P values were calculated using Mann–Whitney–Wilcoxon tests. Source data are available online.

