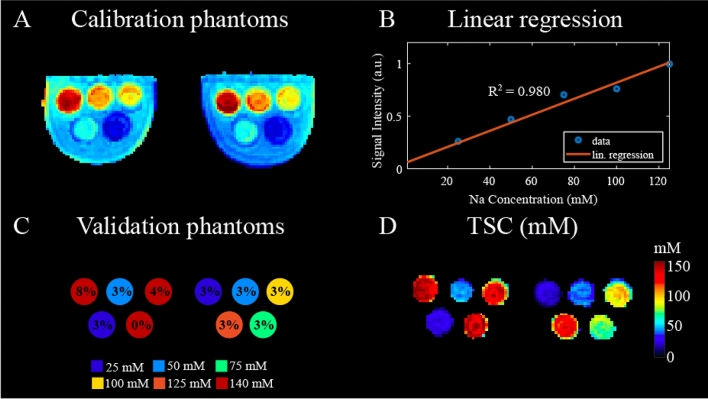
Figure 3.
Total sodium concentration (TSC) calibration and validation in phantoms. (A) Calibration phantoms with ten 3% agar gels with sodium concentration ranging from 25 to 125 mM with 25 mM step. The FLORET dataset was corrected to account for profile and gels relaxation times. (B) Calibration curve, = 0.980. Each point in the plot corresponds to the average signal intensity of two bilateral gels with same sodium concentration. (C) Schematic of validation phantoms consisting of ten gels with agar concentrations between 0 and 8%, which are overlaid for each gel. The true sodium concentrations are color coded and ranged between 25 and 140 mM. (D) TSC map (mM) measured in validation phantoms shows good agreement with ground truth with < 7% error. Specifically, the mean TSC calculated in the 0%, 4% and 8% agar gels (true concentration: 140 mM) were, respectively, mM, mM and mM. In the 3% agar gels (true concentrations: 25, 50, 75, 100, 125 mM) the mean TSC were: mM, mM, mM, 95.5 ± 7.6 mM and mM. The relaxation times of the 0%, 3%, 4% and 8% agar gels are reported in Supplementary Table S1.

