
Figure 2.
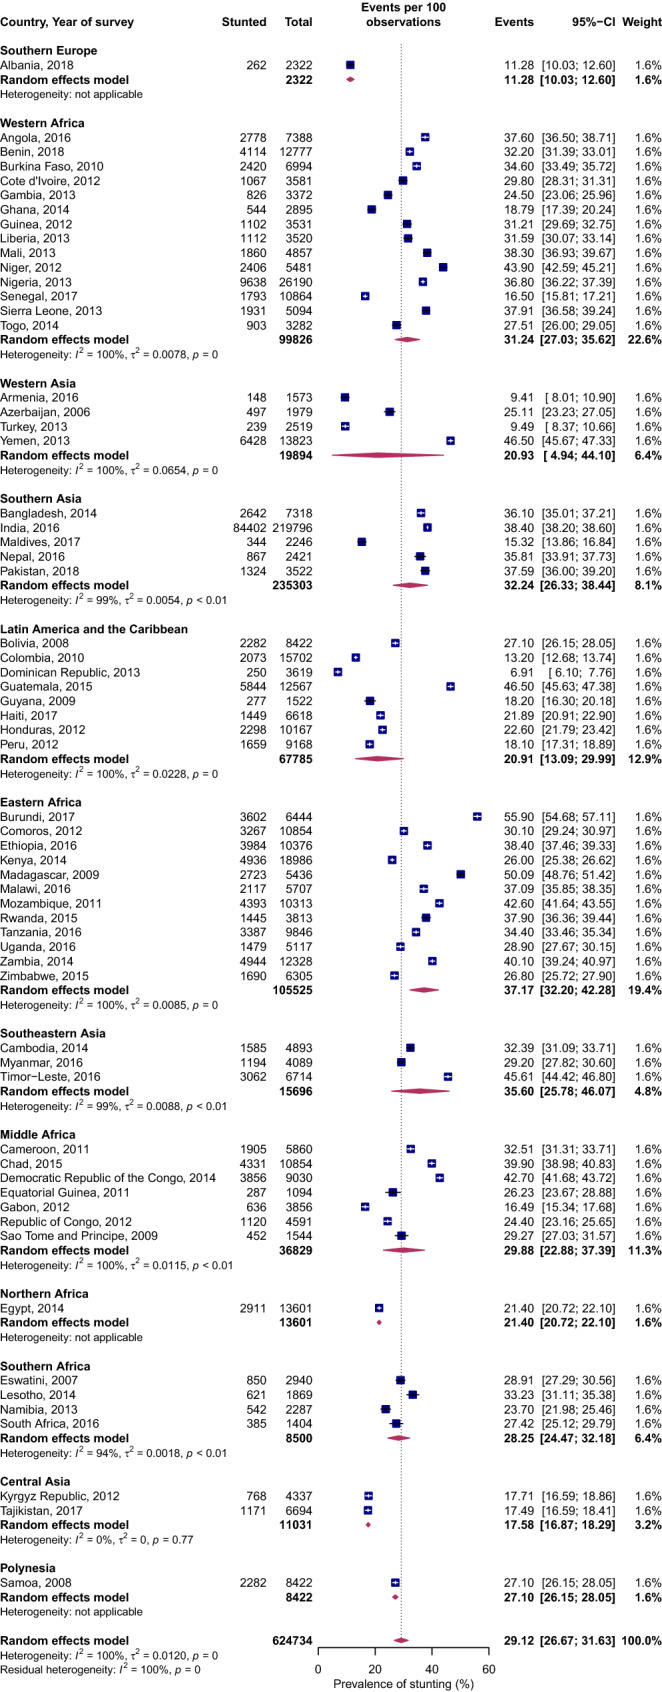
Forest plot of stunting prevalence by UN subregions of LMICs: event values represent the number of cases of stunting expressed as a percentage. Blue squares and their corresponding lines are the point estimates and 95% confidence intervals (95% CI). Maroon diamonds represent the pooled estimate of the prevalence for each subgroup (width denotes 95% CI). Weights are from the random-effects meta-analysis model described by DerSimonian and Laird20 (p for interaction comparing the different subgroups < 0.0001).