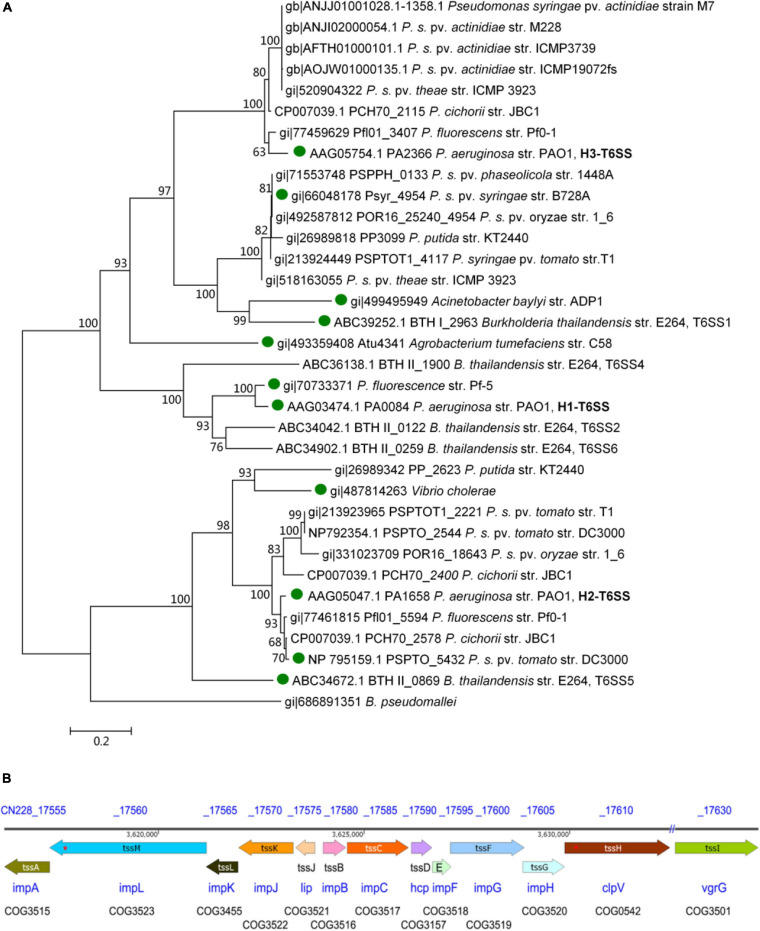
FIGURE 1.
Structure of T6SS gene cluster analysis of the pathogenic strain Psa M228. (A) Molecular phylogenetic analysis by Maximum Likelihood method. The evolutionary history was inferred using the Maximum Likelihood method based on the Le_Gascuel_2008 model (Le and Gascuel, 1993). The bootstrap consensus tree inferred from 1000 replicates was used to represent the evolutionary history of the taxa analyzed (Felsenstein, 1985). Branches corresponding to partitions reproduced in less than 60% bootstrap replicates were collapsed. The percentage of replicate trees in which the associated taxa clustered together in the bootstrap test (1000 replicates) is shown next to the branches (Felsenstein, 1985). The initial tree(s) for the heuristic search were obtained automatically by applying Neighbor-Join and BioNJ algorithms to a matrix of pairwise distances estimated using a JTT model, and the topology with a superior log likelihood value was selected. A discrete Gamma distribution was used to model evolutionary rate differences among sites [five categories (+G, parameter = 2.4316)]. The analysis involved 34 amino acid sequences. All positions containing gaps and missing data were eliminated. A total of 443 positions in the final dataset was obtained. Evolutionary analyses were conducted in MEGA6 (Tamura et al., 2013). According to the results of the phylogenetic tree, one complete T6SS was found in Psa M228 and belonged to the same branch as that of the P. aeruginosa PAO1 H3-T6SS (HIS-III) gene cluster. “ ” indicates the functional T6SS that has been reported. (B). Schematic diagram of theT6SS gene cluster of the pathogenic strain Psa M228. The name of the core genes of T6SS in Psa M228 are indicated by arrows. The direction of the arrows represents the direction of transcription of the genes in the genome. “//” indicates the presence of other genes not belonging to T6SS. “*” indicates the presence of frameshift mutation. The gene products are shown below the arrows. The database of Clusters of Orthologous Groups of proteins (COGs) was obtained from the National Center of Biotechnology Information (see text footnote 1).

