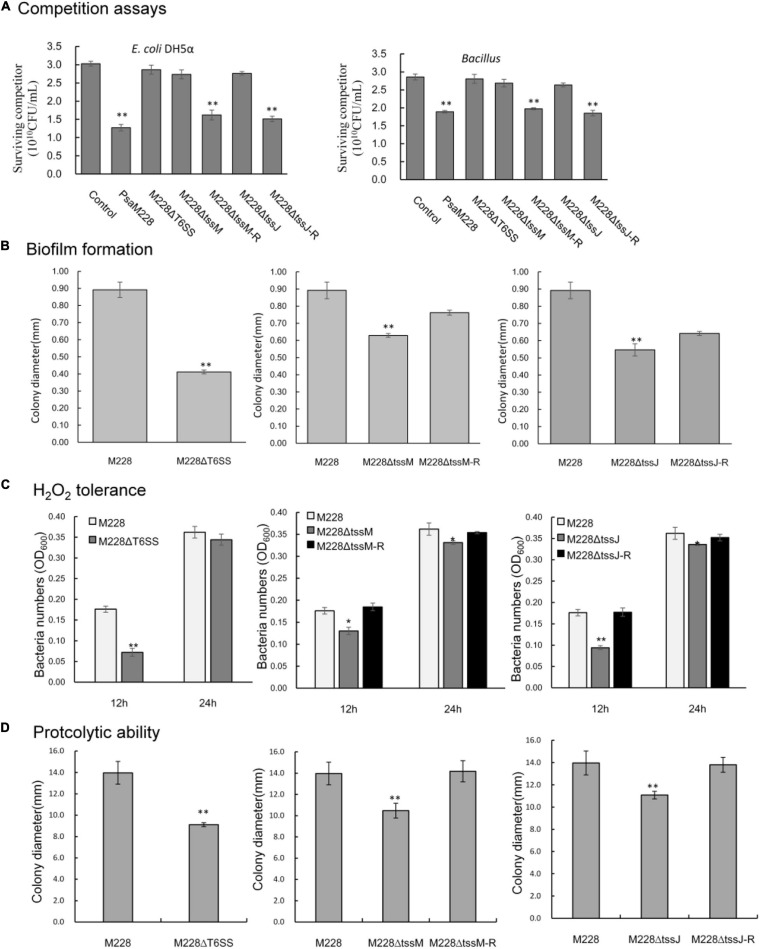
FIGURE 7.
Competitive, biofilm formation, and environmental adaptability analysis of wild-type strain M228 and mutants M228ΔT6SS, M228ΔtssM, and M228ΔtssJ. (A) Bacterial competition assay. When the competitor strains were cocultured with wild-type Psa M228 or the complementation mutants M228ΔtssM-R and M228ΔtssJ-R, the viable cell numbers showed an obvious drop from 46.5, 58.0 to 31.0, and 35.2%, respectively. In contrast, when the competitor strains were cocultured with deletion mutants M228ΔT6SS, M228ΔtssM, and M228ΔtssJ, the survival of competitor bacteria increased up to the same level as that of the control. (B) Biofilm assays. The biofilm formation ability of the three mutants M228ΔT6SS, M228ΔtssM, and M228ΔtssJ was significantly lower than that of the wild-type strain M228 and decreased by 53.8, 29.5, and 38.7%, respectively. The biofilm formation ability was restored to the same level as that of M228 when the deletion genes were restored. (C) H2O2 tolerance assay. The H2O2 tolerance of mutant strains M228ΔT6SS, M228ΔtssM, and M228ΔtssJ was significantly lower than that of the wild-type strain M228, decreased by 59.1, 26.1, and 46.6% at 12 h, respectively, and decreased by 5.0, 8.5, and 7.2% at 24 h, respectively. The H2O2 tolerance was restored when the deletion genes were restored to the same level as that of M228 when the deletion genes were restored. (D) Proteolytic ability assay. The proteolytic ability of mutant strains M228ΔT6SS, M228ΔtssM, and M228ΔtssJ was significantly lower than that of the wild-type strain M228, and decreased by 34.8, 25.0, and 20.66%, respectively. The proteolytic ability was restored when the deletion genes were restored to the same level as that of M228. Statistical significance was determined by Student’s t-test. “*” Means the difference is significant at the 0.05 level; “**” means the difference is significant at the 0.01 level.

