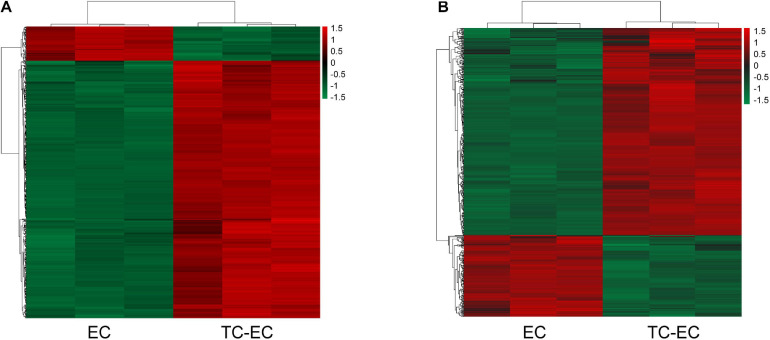
FIGURE 1.
Hierarchical clustering of aberrant expressed mRNAs (A) and lncRNAs (B) detected in the TC–EC model and EC alone. Every column represents a cell sample, and every row represents an mRNA or lncRNA probe. Red color indicates overexpression genes and green color indicates low-expression genes.

