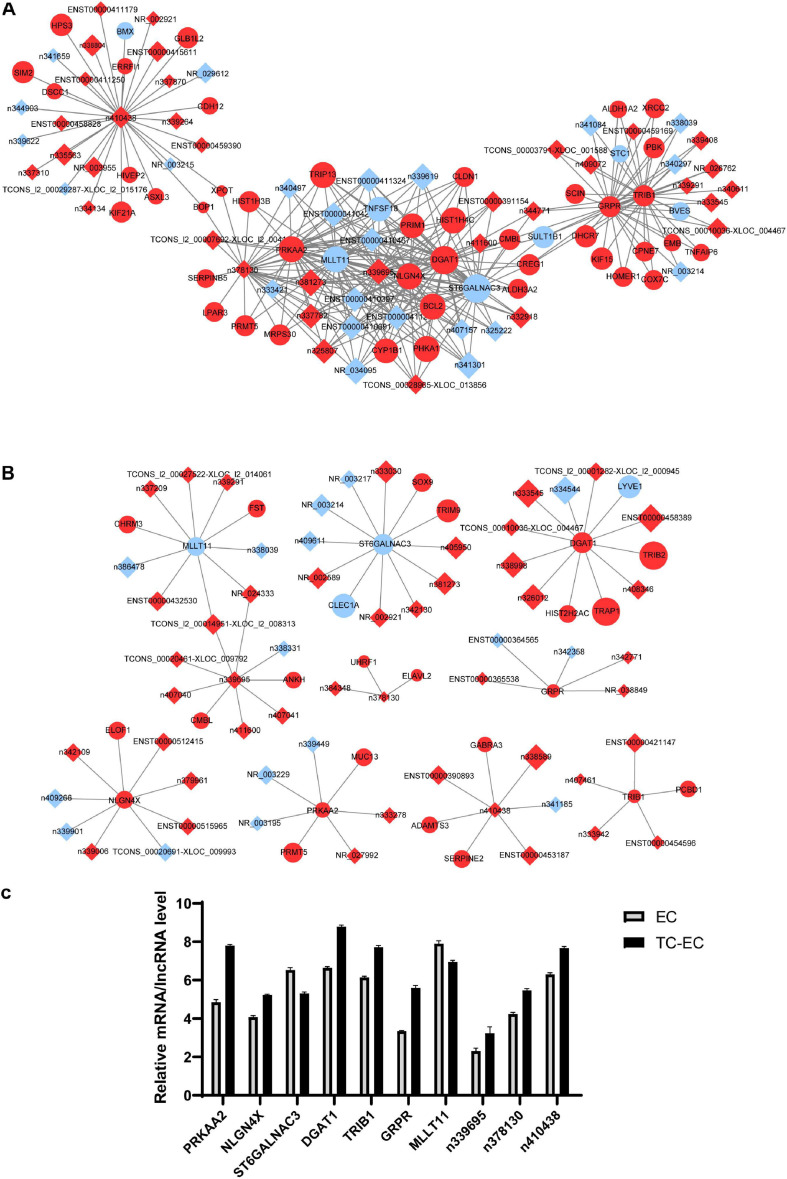
FIGURE 5.
mRNA–lncRNA co-expression network analysis of key mRNAs or lncRNAs in EC alone (A) and TC–EC model (B). In the network, the circle represents mRNA, the rhombic represents lncRNA. Red represents the upregulated mRNAs/lncRNAs, blue represents the downregulated mRNAs/lncRNAs. Those mRNA/lncRNAs without interaction relationships were not displayed in the network. (C) Expression level of the top 10 differential mRNAs or lncRNAs between the TC–EC model and EC according to the mRNA–lncRNA co-expression network analysis.

