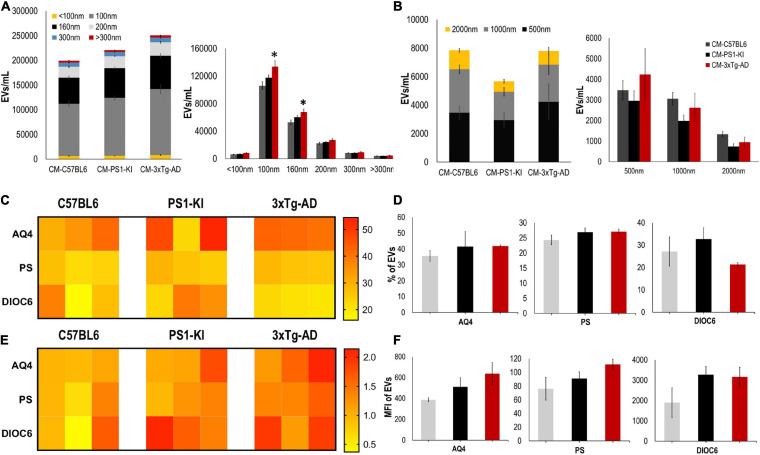
FIGURE 3.
3xTg-AD mice have an increase in A-EVs. (A) Quantification and distribution of EVs numbers from CM treatment according to diameter (<100 and 100 nm: exosomes; 160, 200, and 300 nm: MVs). Significant differences in the number of 100 nm exosomes and 160 nm MVs in 3xTg-AD astrocytes compared with that in the C57BL6 samples. P-value significance *0.05. n from 4 to 8. (B) Quantification and distribution of EVs numbers from CM treatment according to diameter (500; 1000; and 2000 nm). No significant differences in the number of EVs in 3xTg-AD astrocytes compared with that in the other samples. n from 4 to 8. (C) Heatmap of percentages of EVs positive for cell markers (AQ4, astrocyte; Annexin, phosphatidyl-serine and DIOC6, mitochondria) from each astrocyte group. (D) Comparative of percentages of EVs positive of cell markers for grouped data seen in panel (C). (E) Heatmap of the normalized MFI of cell markers (to mean data from C57BL6 individuals). (F) Comparative of MFI of cell markers for grouped data seen in panel (E). Representative data from n = 3. Data were plotted as means and SEM. Kruskal–Wallis test and Dunn’s multiple comparison test. ∗Indicates p < 0.05; ∗∗ indicates p < 0.01.

