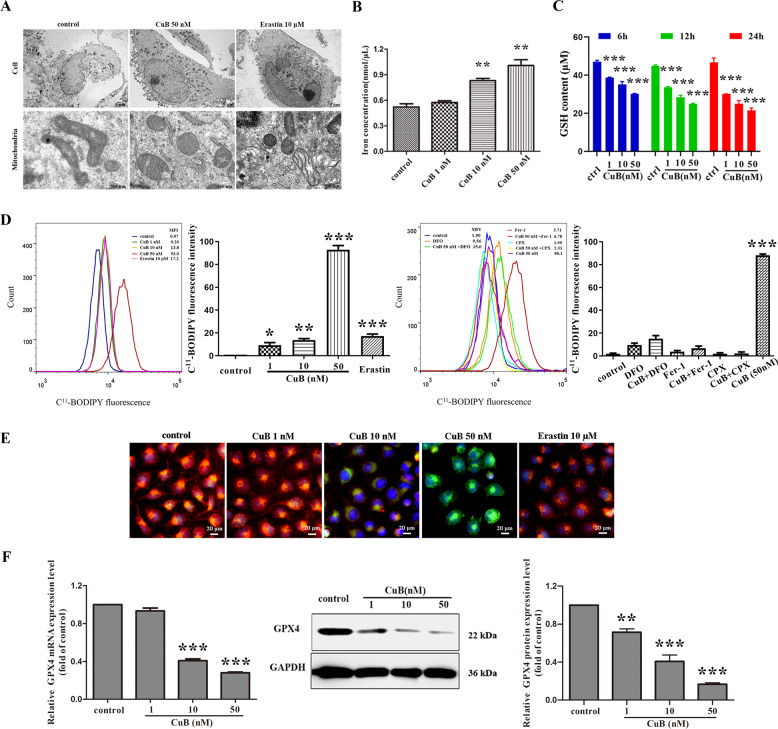
Fig. 4. CuB induced ferroptosis.
A Representative cell and mitochondrial ultrastructural images of CNE1 cells treated with or without CuB (50 nM) or erastin (10 μΜ) for 24 h. The cells were fixed and detected by TEM (HT7700, Hitachi, Ibaraki, Japan). Scale bars: cell, 5 μm; mitochondria, 500 nm. B Intracellular iron content in CNE1 cells exposed to CuB (1, 10, and 50 nM) for 24 h was determined with an iron assay kit (Sigma, USA). **p < 0.01 vs. the control group by t-test using GraphPad Prism 5.0. C Intracellular GSH content in CNE1 cells exposed to CuB (1,10 and 50 nM) for 6 h, 12 h, or 24 h was determined with a GSH assay kit (Beyotime, Jiangsu, China). ***p < 0.001 vs. the control group by t-test using GraphPad Prism 5.0. D The lipid peroxidation generation in CNE1 cells exposed to CuB (1, 10 and 50 nM) with or without Nec1(50 μM), ZVAD(50 μM), Fer-1(5 μM), CPX (5 μM), or DFO (100 μM) for 24 h. Then harvested cells were stained with C11-BODIPY581/591 and analysed by flow cytometer (Navios, Beckman Coulter). A minimum of 10,000 cells were harvested for analysis. [MFI = mean fluorescence intensity]. *p < 0.05, **p < 0.01, and ***p < 0.001 vs. control group by t-test using GraphPad Prism 5.0. E The fluorescent images of lipid peroxidation in CNE1 cells using C11-BODIPY-581/591 probe after incubation with CuB (1, 10, and 50 nM) or erastin (10 μM) for 24 h. Scale bar: 20 μm. (F) The mRNA level of GPX4 quantified by qRT-PCR and western blot analysis of GPX4 in CNE1 cells with or without CuB (1, 10, and 50 nM) for 24 h. Quantitative analysis was performed by Image J (NIH, MD, USA). ***p < 0.001 vs. control group by t-test using GraphPad Prism 5.0. Data were presented as the mean ± SEM of three independent experiments.

