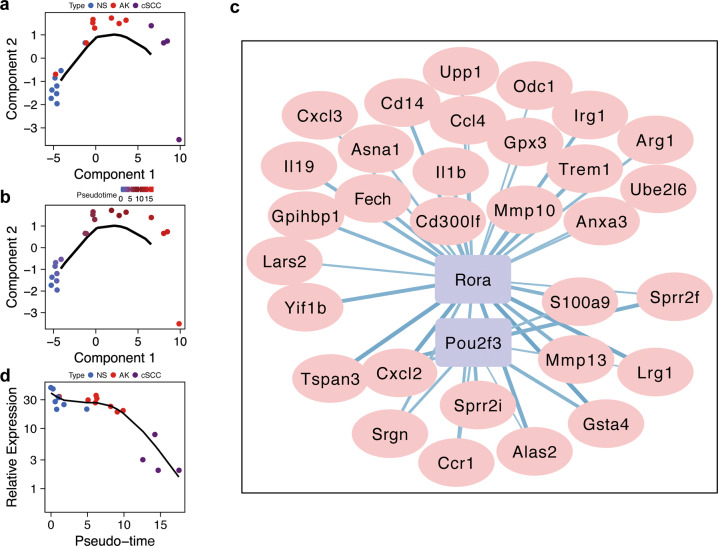
Fig. 3. Reconstructed progression trajectory of UV-induced cSCC are regulated by Rorα.
a Distribution of NS, AK, and cSCC samples in the pseudo-time trajectory analysis. b Samples were highlighted by pseudo-time in the trajectory, which showed a progression from NS to AK then cSCC. c Co-expressed network calculated between TFs and genes among the cSCC progression-driven genes. Purple rectangle nodes represent TFs and plink elliptic nodes represent genes. d Rorα expression with regards to the trajectory pseudo-time. Rorα expression was significantly downregulated in cSCC group.

