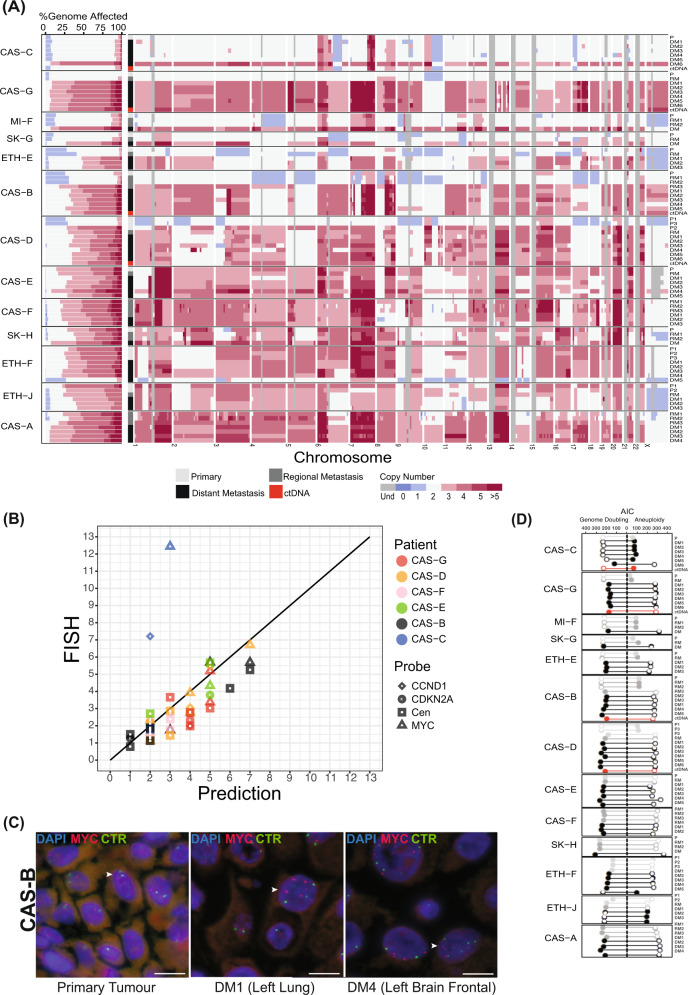
Fig. 4. Ubiquitous hyperploidy in metastatic melanoma.
A Left: genomic proportions of each tissue sample affected by copy number alterations (CNAs). Horizontal bars indicate the fraction of each genome with the indicated allelic copy number. Regions with total CN > 5 are represented by the same colour. Grey regions indicate undetermined CN. Right: CNAs in each sample at the cytogenetic band-level. B Validation of CN in 6 patients using Fluorescence In Situ Hybridisation (FISH). X-axis corresponds to the total CN of the segment overlapping the FISH probe predicted from sequencing data. Y-axis corresponds to the average CN across cells in each sample, determined by manual counting, for the indicated FISH probe. Centromeric probes corresponded to chromosomes 8, 9 and 11 as controls for probes for MYC, CDKN2A and CCND1, respectively, in those chromosomes. Cen: Centromeric probe. C FISH showing MYC amplification in two metastases from patient CAS-B, compared to the primary tumour (left). Arrow heads indicate cells with red (Myc) and green (centromere) signals. Scale bar = 10um. CTR: Centromere probes for chromosome 8. D Widespread genome doubling in melanoma. For each sample, the bar length indicates the Akaike Information Criteria (AIC) score obtained via branching process analyses of aneuploidy with genome doubling (left) versus aneuploidy alone (right). Solid circles indicate the most likely scenario for each sample.

