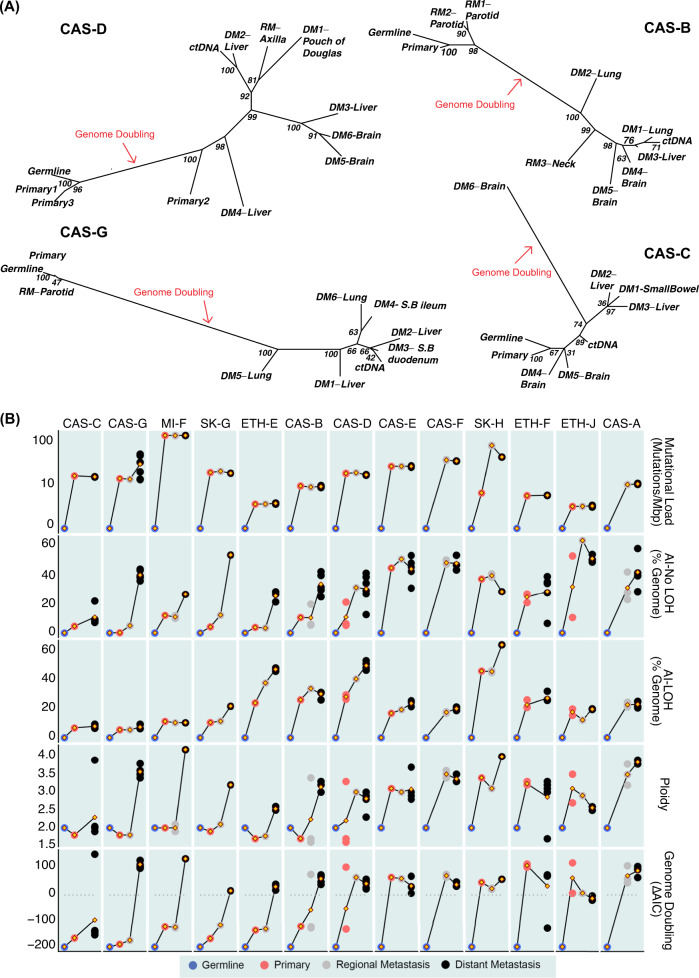
Fig. 6. Evolution of cutaneous melanoma.
A Copy number-based phylogenetic trees for patients CAS-D, CAS-B, CAS-G and CAS-C. Evolutionary relationships between samples were derived using MEDICC, based on allele-specific copy numbers. Support values for each node were obtained by resampling of the distance matrix. MEDICC treated genome doubling events as independent chromosomal amplifications, resulting in long branch lengths. S.B.: Small Bowel. B Summarised genetic changes in the progression to end-stage melanoma. From top to bottom: evolution of somatic mutational load (mutations/Mbps), allelic imbalance without LOH (% genome affected), allelic imbalance with LOH (% genome affected), average ploidy, and evidence for genome doubling (ΔAIC = AICnon-WGD-AICWGD, where AICnon-WGD is the Akaike Information Criterion (AIC) for the model with aneuploidy only, and AICWGD is the AIC for the model that includes WGD; ΔAIC > 0 supports genome doubling) across primary melanomas and regional and distant metastases for each patient. Germline estimates are depicted as comparative references. Yellow diamonds joining lines represent mean values for each time of disease. Each dot represents an individual tissue sample.

