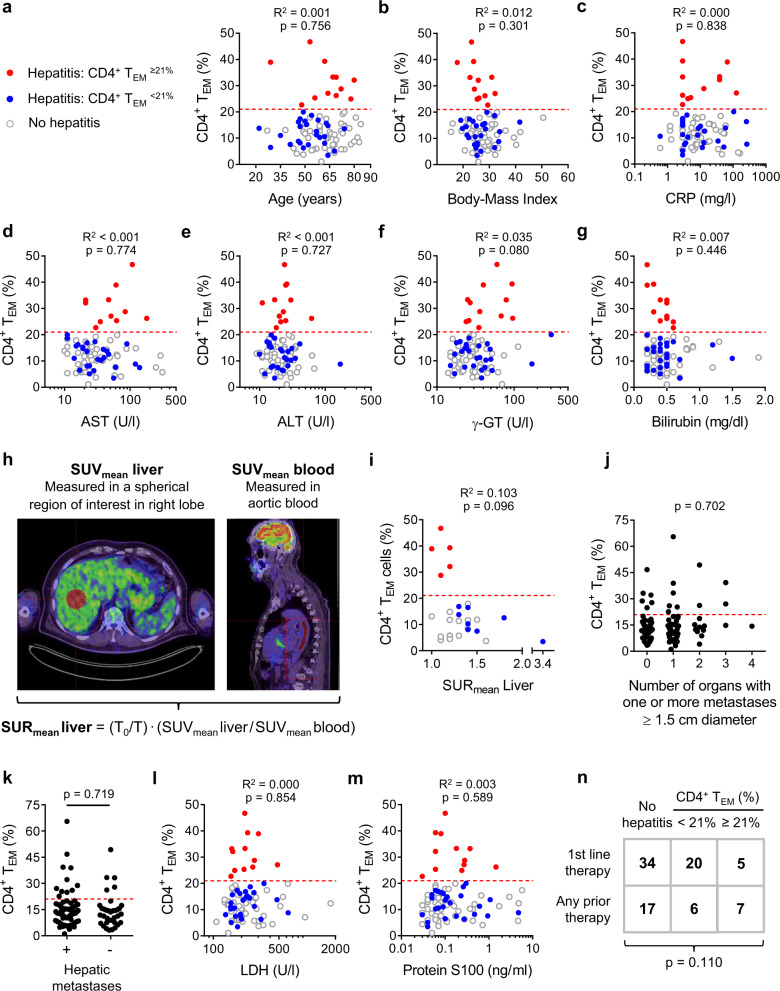
Fig. 3. CD4+ TEM frequency is an independent predictor of αPD-1/αCTLA-4-related hepatitis.
a CD4+ TEM % did not correlate with age (n = 89; Pearson). Dashed red line indicates a cut-off of CD4+ TEM ≥ 21%. b CD4+ TEM % did not correlate with body mass index (n = 89; Pearson). c CD4+ TEM % did not correlate with C-reactive protein (CRP) levels (n = 85; Pearson). d CD4+ TEM % did not correlate with aspartate aminotransferase (AST) levels (n = 87; Pearson). e CD4+ TEM % did not correlate with alanine aminotransferase (AST) levels (n = 89; Pearson). f CD4+ TEM % did not correlate with gamma-glutamyltransferase (γ-GT) levels (n = 89; Pearson). g CD4+ TEM % did not correlate with total bilirubin levels (n = 89; Pearson). h Glucose metabolism measured by 18F-fluoro-2-deoxy-d-glucose (18F-FDG) uptake in PET/CT studies is a quantitative marker of liver inflammation. Calculating standard uptake ratio (SURmean Liver) allows accurate quantification of 18F-FDG uptake in liver by correcting for differential clearance of tracer from blood and liver parenchyma. Higher SURmean Liver values indicate more severe inflammation. T0 = reference time point at 75 min post-injection and T = actual scan time. i SURmean Liver was lower in CD4+ TEM≥21% patients than CD4+ TEM<21% patients who developed hepatitis indicating less inflammation at baseline in the CD4+ TEM≥21% subgroup (n = 28; Pearson). j CD4+ TEM≥21% was not associated with the number of organs containing one or more metastases ≥1.5 cm in diameter (n = 103; F.E.). k CD4+ TEM≥21% was not associated with the presence of hepatic metastases (n = 103; F.E.). l CD4+ TEM % did not correlate with lactate dehydrogenase (LDH) levels (n = 88; Pearson). m CD4+ TEM % did not correlate with protein S100 levels (n = 88; Pearson). n CD4+ TEM≥21% was not associated with any prior therapy (n = 89; F.E.).

