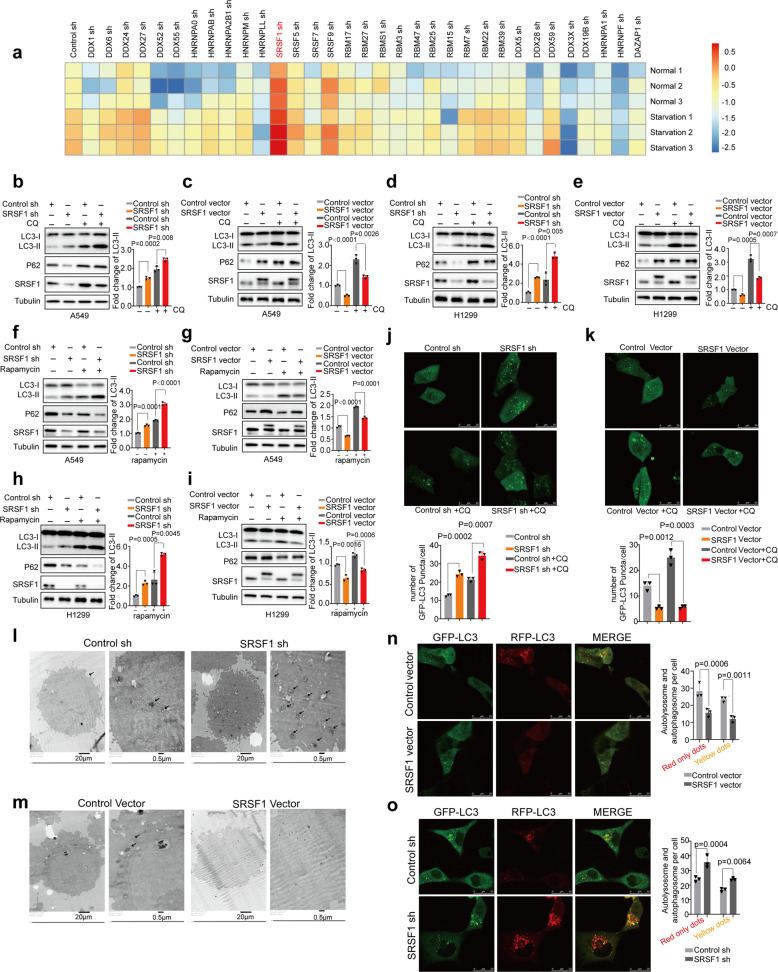
Fig. 1.
SRSF1 suppresses autophagy by inhibiting autophagosome formation. a Heatmap depicting the log2-scaled level of LC3-II/Tubulin when splicing factors were knocked down by distinct shRNAs in starved and control A549 lung cancer cells. Three replicates were shown for each group. b, c The protein levels of LC3, p62, and SRSF1 were examined in A549 cells with stable knockdown or overexpression of SRSF1 or control. Cells were treated without or with CQ (40 µM for 2 h). d, e The protein levels of LC3, p62, and SRSF1 were measured in H1299 cells with stable knockdown or overexpression of SRSF1 or control vector in the absence or presence of CQ (40 µM for 2 h). f, g A549 cells stably decreased or overexpressed SRSF1 or control were treated with Rapamycin, an inhibitor of mTOR pathway. The protein levels of LC3, p62, and SRSF1 were determined. h, i H1299 cells stably decreased or overexpressed SRSF1 or control were treated with Rapamycin, and the protein levels of LC3, p62, and SRSF1 were examined. The densities of signals were determined by densitometry and three experiments were carried out with mean ± SD of relative fold change of LC3-II plotted in b–i. j A549 cells with stable reduction of SRSF1 or control were transfected with GFP-LC3. Twenty-four hours later, cells were treated with or without CQ for 4 h. Three experiments were performed and the number of GFP-LC3 puncta per cell are represented with mean ± SD. k A549 cells stably overexpressed SRSF1 or control vector were transfected with GFP-LC3. Twenty-four hours later, cells were treated with or without CQ (40 µM) for 4 h. Three experiments were performed and the number of GFP-LC3 puncta per cell are represented with mean ± SD. l, m The autophagosomes of A549 cells with stable knockdown or overexpression of SRSF1 were examined with transmission electron microscopy (TEM). Autophagosomes was indicated by black arrows. n, o A549 cells with stable knockdown or overexpression of SRSF1 were transfected with GFP-mRFP-LC3 to examine the expression of GFP and RFP by confocal microscope. Three experiments were carried out with mean ± SD of the number of autophagosomes (yellow dots) and autolysosomes (red-only dots) per cell plotted. The p values were calculated by t-test in all panels

