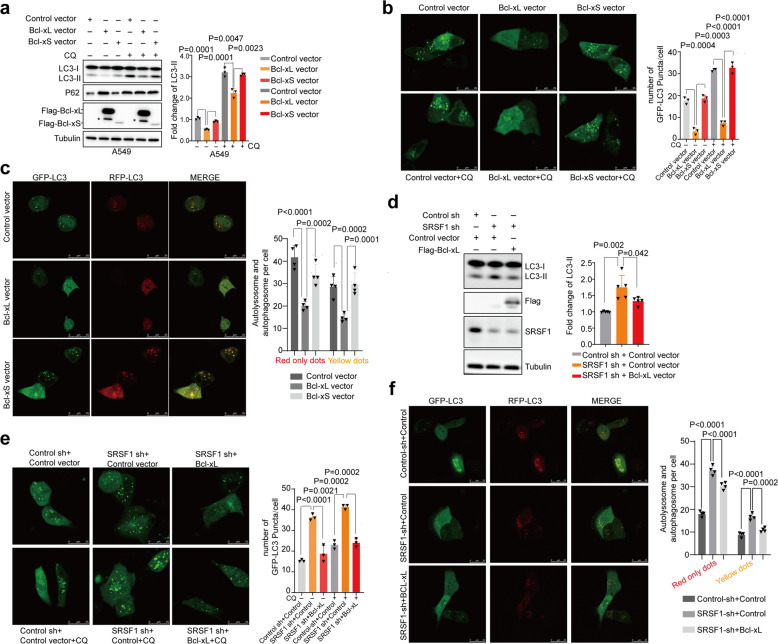
Fig. 3.
Bcl-x isoforms differentially regulate autophagy. a The protein levels of LC3 and p62 were determined in A549 cells with stable overexpression of Flag-Bcl-xL, Flag-Bcl-xS, or control vector. The resulting cells were treated without or with CQ (40 µM for 2 h) respectively. The densities of signals were measured by densitometry and three experiments were performed with mean ± SD of relative fold change of LC3-II plotted. Asterisk indicated nonspecific bands. b A549 cells with stable overexpression of Bcl-xL, Bcl-xS, or control vector were transfected with GFP-LC3 respectively. Twenty-four hours after transfection, cells were treated with or without CQ. Three experiments were carried out and the number of GFP-LC3 puncta per cell are represented with mean ± SD. c A549 cells with stably overexpressed Bcl-xL, Bcl-xS, or control vector were transfected with GFP-mRFP-LC3 to examine the expression of GFP and RFP by confocal microscope. Four experiments were carried out with mean ± SD of the number of autophagosomes (yellow dots) and autolysosomes (red-only dots) per cell plotted. d A549 cells with stable decrease of SRSF1 or control were transiently transfected with Flag-Bcl-xL or control vector. The protein levels of LC3 and SRSF1 were examined in a western blot assay. The densities of signals were analyzed by densitometry and five experiments were carried out with mean ± SD of relative fold change of LC3-II plotted. e A549 cells with stable decrease of SRSF1 or control were transiently transfected with Flag-Bcl-xL or control vector and GFP-LC3. Twenty-four hours after transfection, cells were treated with or without CQ. Three experiments were performed and the number of GFP-LC3 puncta per cell are represented with mean ± SD. f A549 cells with stable reduction of SRSF1 or control were transiently transfected with Flag-Bcl-xL or control vector and GFP-mRFP-LC3 to examine the expression of GFP and RFP by confocal microscope. Four experiments were carried out with mean ± SD of the number of autophagosomes (yellow dots) and autolysosomes (red-only dots) per cell plotted. The p values were calculated by t-test in all panels

