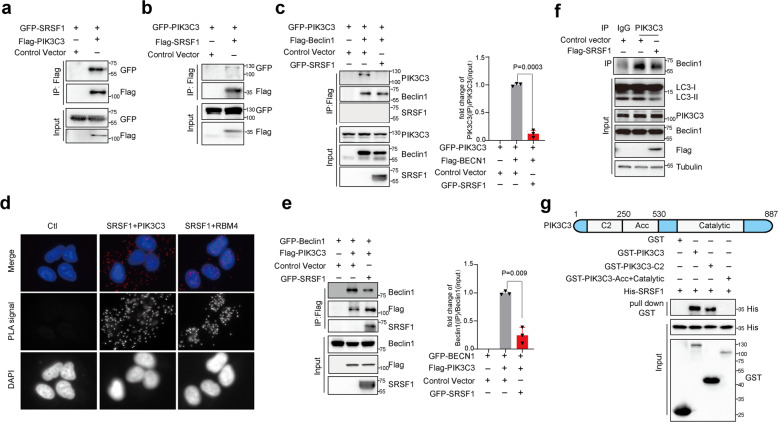
Fig. 5.
SRSF1 interacts with PIK3C3 to disrupt the Beclin-PIK3C3 complex and suppresses autophagy. 293 T cells were co-transfected with different combinations of Beclin1, PIK3C3, and SRSF1 expression vectors in a–c and e. a 293 T cells were co-transfected with pEGFP-C1-SRSF1 and control vector; or pEGFP-C1-SRSF1 and Flag-PIK3C3 expression vector. b 293 T cells were co-transfected with pEGFP-C1-PIK3C3 and control vector; or pEGFP-C1-PIK3C3 and Flag-SRSF1 expression vector. c 293 T cells were co-transfected with pEGFP-C1-PIK3C3 and control vector; or pEGFP-C1-PIK3C3 and Flag-Beclin1 expression vector; or pEGFP-C1-PIK3C3, Flag-Beclin1, and GFP-SRSF1 expression vectors. d Proximity ligation assay (PLA) was performed to examine the endogenous interaction between SRSF1 and PIK3C3 in A549 cells. The examination of the endogenous interaction between SRSF1 and RBM4 was assayed as a positive control. PLA signals were shown in red and the nuclei were demonstrated in blue. e 293 T cells were co-transfected with pEGFP-C1-Beclin1 and control vector; or pEGFP-C1-Beclin1, and Flag-PIK3C3 expression vector; or pEGFP-C1-Beclin1, Flag-PIK3C3 and GFP-SRSF1 expression vectors. Immunoprecipitation assay was performed with anti-Flag M2 beads and the precipitated complexes were analyzed by western blot with anti-Beclin1, anti-PIK3C3, or anti-SRSF1 antibodies in c, e. Three experiments were conducted and the mean ± SD of the relative ratio of the precipitated Beclin1 or PIK3C3 were analyzed and plotted in c, e. f H1299 cells with overexpression of SRSF1 were used for the immunoprecipitation experiments. Immunoprecipitation assay was performed with anti-PIK3C3 antibody and the precipitated complexes were measured by western blot assay with anti-Beclin1 antibody. The lysate was applied to examine the autophagy status. g GST pull-down assays to analyze direct binding of recombinant human GST-tagged PIK3C3, GST-tagged PIK3C3 C2 domain, GST-tagged PIK3C3 Acc Catalytic domain and His-tagged SRSF1. The p values were calculated by t-test in panels c, e

