Fig. 6.
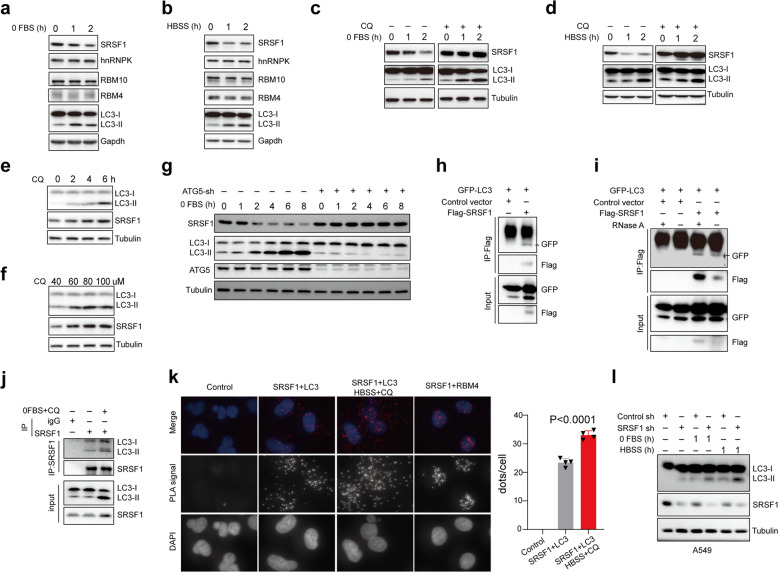
SRSF1 is degraded by starvation-induced autophagy through LC3 conjugation. a, b A549 cells were treated with serum-free medium or HBSS medium for the indicated time. Proteins were isolated from the resulting cells and the levels of SRSF1, hnRNP K, RBM10, RBM4, and LC3 were determined with a western blot assay. c A549 cells were treated with serum-free medium for the indicated time without or with CQ treatment (100 µM). The cell lysates were collected to examine the protein levels of SRSF1 and LC3 using a western blot assay. d A549 cells were treated with HBSS medium for the indicated time without or with CQ treatment (100 µM). The cell lysates were isolated to measure the protein levels of SRSF1 and LC3 by the western blot approach. e A549 cells were treated with 40 µM CQ for 0, 2, 4, and 6 h, respectively. The protein levels of LC3 and SRSF1 were measured with a western blot assay. f A549 cells were treated with different concentrations of CQ, respectively, (40, 60, 80, and 100 µM) for 4 h. The protein levels of LC3 and SRSF1 were measured with a western blot assay. g HeLa cells with stable knockdown of ATG5 or control were treated with serum-free medium for the indicated time. The cell lysates were isolated to measure the protein levels of SRSF1, LC3-II, and ATG5 by western blot. h 293 T cells were co-transfected with pEGFP-C1-LC3 and control vector; or pEGFP-C1-LC3 and Flag-SRSF1 expression vector. Co-immunoprecipitation assay was carried out with anti-Flag M2 beads and the precipitated complexes were analyzed by a western blot assay with anti-GFP, or anti-Flag antibodies. i 293 T cells were co-transfected with pEGFP-C1-LC3 and control vector; or pEGFP-C1-LC3 and Flag-SRSF1 expression vector. Co-immunoprecipitation assay was performed with anti-Flag M2 beads under the condition with or without RNase A treatment and the precipitated complexes were analyzed by a western blot experiment with anti-GFP, or anti-Flag antibodies. j Immunoprecipitation was carried out with SRSF1 antibody. Endogenous LC3 was measured using western blots in immunoprecipitated complexes. k Proximity ligation assay (PLA) was performed to examine the endogenous interaction between SRSF1 and LC3 in A549 cells in the absence or presence of HBSS and CQ for 4 h. The examination of the endogenous interaction between SRSF1 and RBM4 was assayed as a positive control. PLA signals were shown in red and the nuclei were demonstrated in blue. Three experiments were carried out and the number of dots of PLA signals were counted by using Image J and represented with mean ± SD. l A549 cells with stable knockdown of SRSF1 or control were treated with or without serum-free, or HBSS medium for 1 h. Cell lysates isolated from the treated cells were applied to western blots to determine the protein levels of LC3 and SRSF1

