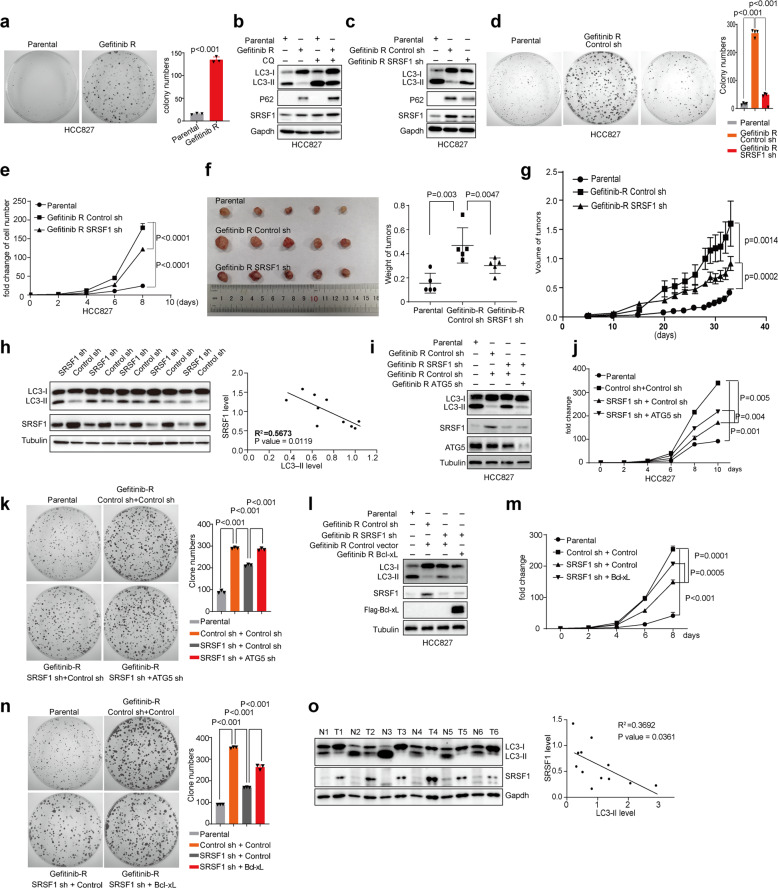
Fig. 7.
Reduced SRSF1 inhibits Gefitinib-resistant cancer cell progression by activating autophagy. a The growth ability of parental and Gefitinib-resistant HCC827 cells were examined by colony formation assay. Representative pictures of the whole plates from triplicate experiments are shown. The mean ± SD of colony numbers were plotted, with p values calculated by t-test. b The parental and Gefitinib-resistant HCC827 cells were treated without or with CQ (40 µM for 2 h). The protein levels of SRSF1, LC3, and p62 in the parental and Gefitinib-resistant HCC827 cells were measured with western blots. c The parental, and Gefitinib-resistant HCC827 cells with stable knockdown of SRSF1 or control were applied to examine the protein levels of LC3, p62, and SRSF1 with western blots. (d) The growth abilities of the parental, Gefitinib-resistant HCC827 cells stably depleted SRSF1 or control were determined by colony formation assay. Representative pictures of the whole plates from triplicate experiments are shown. The mean ± SD of colony numbers were plotted, with p values calculated by t-test. e The parental, Gefitinib-resistant HCC827 cells stably depleted SRSF1 or control were grown for 8 days, with cell numbers counted every 2 days. The changes of cell numbers were compared to day 0. The mean ± SD from three experiments was plotted. f The parental HCC827 cells, and Gefitinib-resistant HCC827 cells stably knocked down SRSF1 or control were subcutaneously injected into the flank of nude mice. Each group contained five mice. Pictures of the tumors removed after 32 days were shown. Tumors were weighed and plotted. g The average sizes of xenograft tumors were measured every four or 2 days (n = 5, error bars indicate ±SD, p < 0.05 by t-test). h Proteins isolated from tumors removed from mice were assayed by western blot approach to examine the levels of LC3 and SRSF1. The correlation of the levels of SRSF1 and LC3-II were plotted. i The parental, Gefitinib-resistant HCC827 cells with stable knockdown of control, SRSF1, SRSF1, and ATG5, were collected to determine the protein levels of LC3, ATG5, and SRSF1 using western blot assay. j The parental, Gefitinib-resistant HCC827 cells stably knocked down SRSF1, SRSF1, and ATG5, or control were grown for 10 days, with cell numbers counted every two days. The changes of cell numbers were compared to day 0. The mean ± SD from three experiments was plotted. k The growth abilities of the parental, Gefitinib-resistant HCC827 cells with stable depletion of SRSF1, SRSF1, and ATG5, or control were determined by colony formation assay. Representative pictures of the whole plates from triplicate experiments are shown. The mean ± SD of colony numbers were plotted, with p values calculated by t-test. l The parental, Gefitinib-resistant HCC827 cells with stable knockdown of control or SRSF1, overexpression of Bcl-xL, re-expression of Bcl-xL upon depletion of SRSF1, were collected to determine the protein levels of LC3, Flag-Bcl-xL and SRSF1 using western blot assay. m The parental, Gefitinib-resistant HCC827 cells with stable knockdown of control or SRSF1, overexpression of Bcl-xL, re-expression of Bcl-xL upon depletion of SRSF1, were grown for 8 days, with cell numbers counted every two days. The changes of cell numbers were compared to day 0. The mean ± SD from three experiments was plotted. n The growth abilities of the parental, Gefitinib-resistant HCC827 cells with stable knockdown of control or SRSF1, overexpression of Bcl-xL, re-expression of Bcl-xL upon depletion of SRSF1, were determined by colony formation assay. Representative pictures of the whole plates from triplicate experiments are shown. The mean ± SD of colony numbers were plotted, with p values calculated by t-test. o LC3 and SRSF1 levels from six paired NSCLC tumors (T) and normal (N) tissues were evaluated by western blots. The correlation between the levels of SRSF1 and LC3 was plotted

