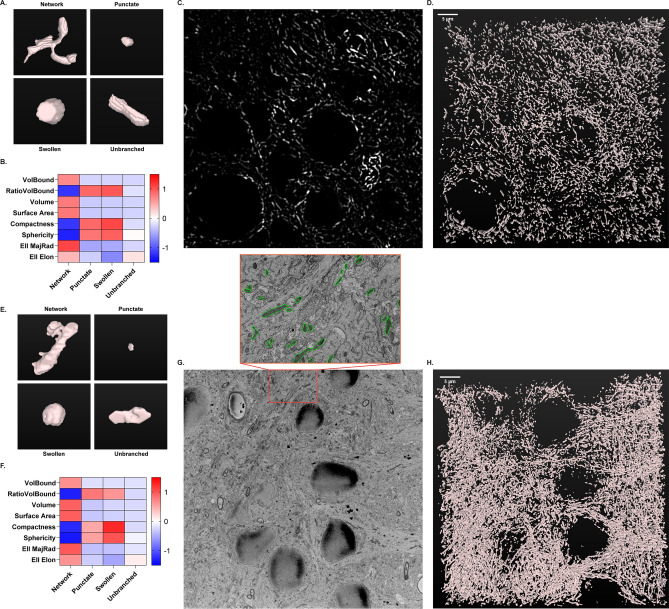
Figure 5.
3D morphological classification of mitochondria using confocal (A–C) and electron microscopy (D–F). (A) Representative 3D renderings of individual mitochondrial objects from mouse brain tissue immuno-labeled for ATP synthase and imaged using confocal microscopy. (B) Heatmap displaying the scaled 8 size and shape measurements by morphology for confocal microscopy. (C) Representative confocal image of ATP synthase immunofluorescence from mouse hippocampus. (D) 3D rendering of mitochondria from the full z-series (50 slices, 5 µm) of the image shown in (C), acquired via confocal microscopy. (E) Representative 3D renderings of individual mitochondrial objects from rat brain tissue acquired via serial block-face scanning electron microscopy (SBF-SEM). (F) Heatmap displaying the scaled 8 size and shape measurements by morphology for SBF-SEM. (G) Representative single-plane image from SBF-SEM z-series. Insert: Enlarged area of representative image with mitochondria traced (green). (H) 3D rendering of mitochondria from the full z-series (100 slices, 7 µm) of the image shown in (G), acquired via SBF-SEM.

